Belizean vs Cape Verdean Median Female Earnings
COMPARE
Belizean
Cape Verdean
Median Female Earnings
Median Female Earnings Comparison
Belizeans
Cape Verdeans
$37,429
MEDIAN FEMALE EARNINGS
0.9/ 100
METRIC RATING
258th/ 347
METRIC RANK
$38,614
MEDIAN FEMALE EARNINGS
9.5/ 100
METRIC RATING
218th/ 347
METRIC RANK
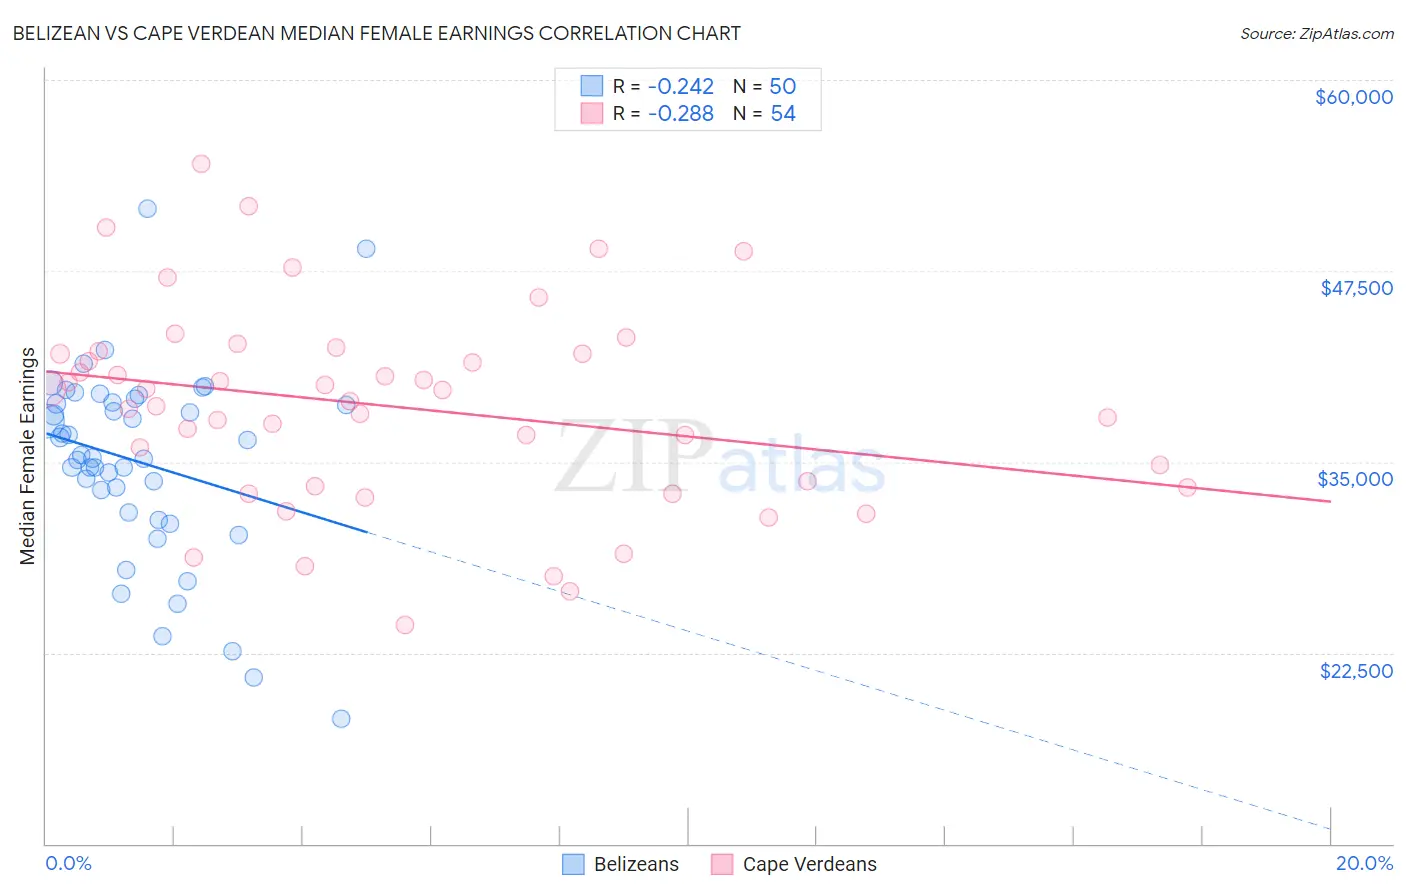
Belizean vs Cape Verdean Median Female Earnings Correlation Chart
The statistical analysis conducted on geographies consisting of 144,203,712 people shows a weak negative correlation between the proportion of Belizeans and median female earnings in the United States with a correlation coefficient (R) of -0.242 and weighted average of $37,429. Similarly, the statistical analysis conducted on geographies consisting of 107,559,338 people shows a weak negative correlation between the proportion of Cape Verdeans and median female earnings in the United States with a correlation coefficient (R) of -0.288 and weighted average of $38,614, a difference of 3.2%.
Median Female Earnings Correlation Summary
| Measurement | Belizean | Cape Verdean |
| Minimum | $18,201 | $24,340 |
| Maximum | $51,565 | $54,554 |
| Range | $33,364 | $30,214 |
| Mean | $34,988 | $38,613 |
| Median | $35,337 | $39,359 |
| Interquartile 25% (IQ1) | $31,707 | $33,431 |
| Interquartile 75% (IQ3) | $38,920 | $42,075 |
| Interquartile Range (IQR) | $7,213 | $8,644 |
| Standard Deviation (Sample) | $6,353 | $6,549 |
| Standard Deviation (Population) | $6,289 | $6,488 |
Similar Demographics by Median Female Earnings
Demographics Similar to Belizeans by Median Female Earnings
In terms of median female earnings, the demographic groups most similar to Belizeans are Scotch-Irish ($37,383, a difference of 0.12%), Hawaiian ($37,497, a difference of 0.18%), Samoan ($37,498, a difference of 0.19%), Colville ($37,514, a difference of 0.23%), and Dutch ($37,339, a difference of 0.24%).
| Demographics | Rating | Rank | Median Female Earnings |
| Welsh | 2.1 /100 | #251 | Tragic $37,856 |
| Immigrants | Dominica | 2.0 /100 | #252 | Tragic $37,825 |
| Danes | 1.6 /100 | #253 | Tragic $37,730 |
| Whites/Caucasians | 1.1 /100 | #254 | Tragic $37,531 |
| Colville | 1.1 /100 | #255 | Tragic $37,514 |
| Samoans | 1.0 /100 | #256 | Tragic $37,498 |
| Hawaiians | 1.0 /100 | #257 | Tragic $37,497 |
| Belizeans | 0.9 /100 | #258 | Tragic $37,429 |
| Scotch-Irish | 0.8 /100 | #259 | Tragic $37,383 |
| Dutch | 0.7 /100 | #260 | Tragic $37,339 |
| Malaysians | 0.7 /100 | #261 | Tragic $37,298 |
| Venezuelans | 0.7 /100 | #262 | Tragic $37,282 |
| German Russians | 0.5 /100 | #263 | Tragic $37,105 |
| Salvadorans | 0.4 /100 | #264 | Tragic $37,083 |
| Immigrants | Belize | 0.4 /100 | #265 | Tragic $37,056 |
Demographics Similar to Cape Verdeans by Median Female Earnings
In terms of median female earnings, the demographic groups most similar to Cape Verdeans are Immigrants from Jamaica ($38,625, a difference of 0.030%), Nepalese ($38,603, a difference of 0.030%), Immigrants from Ecuador ($38,644, a difference of 0.080%), Spaniard ($38,656, a difference of 0.11%), and Yugoslavian ($38,573, a difference of 0.11%).
| Demographics | Rating | Rank | Median Female Earnings |
| Aleuts | 11.6 /100 | #211 | Poor $38,719 |
| Guamanians/Chamorros | 11.5 /100 | #212 | Poor $38,717 |
| Jamaicans | 10.5 /100 | #213 | Poor $38,670 |
| Iraqis | 10.5 /100 | #214 | Poor $38,666 |
| Spaniards | 10.3 /100 | #215 | Poor $38,656 |
| Immigrants | Ecuador | 10.1 /100 | #216 | Poor $38,644 |
| Immigrants | Jamaica | 9.7 /100 | #217 | Tragic $38,625 |
| Cape Verdeans | 9.5 /100 | #218 | Tragic $38,614 |
| Nepalese | 9.3 /100 | #219 | Tragic $38,603 |
| Yugoslavians | 8.8 /100 | #220 | Tragic $38,573 |
| Immigrants | Azores | 8.8 /100 | #221 | Tragic $38,573 |
| Japanese | 8.1 /100 | #222 | Tragic $38,528 |
| Immigrants | Sudan | 7.8 /100 | #223 | Tragic $38,511 |
| Native Hawaiians | 7.1 /100 | #224 | Tragic $38,461 |
| French | 7.0 /100 | #225 | Tragic $38,457 |