Belizean vs White/Caucasian Median Female Earnings
COMPARE
Belizean
White/Caucasian
Median Female Earnings
Median Female Earnings Comparison
Belizeans
Whites/Caucasians
$37,429
MEDIAN FEMALE EARNINGS
0.9/ 100
METRIC RATING
258th/ 347
METRIC RANK
$37,531
MEDIAN FEMALE EARNINGS
1.1/ 100
METRIC RATING
254th/ 347
METRIC RANK
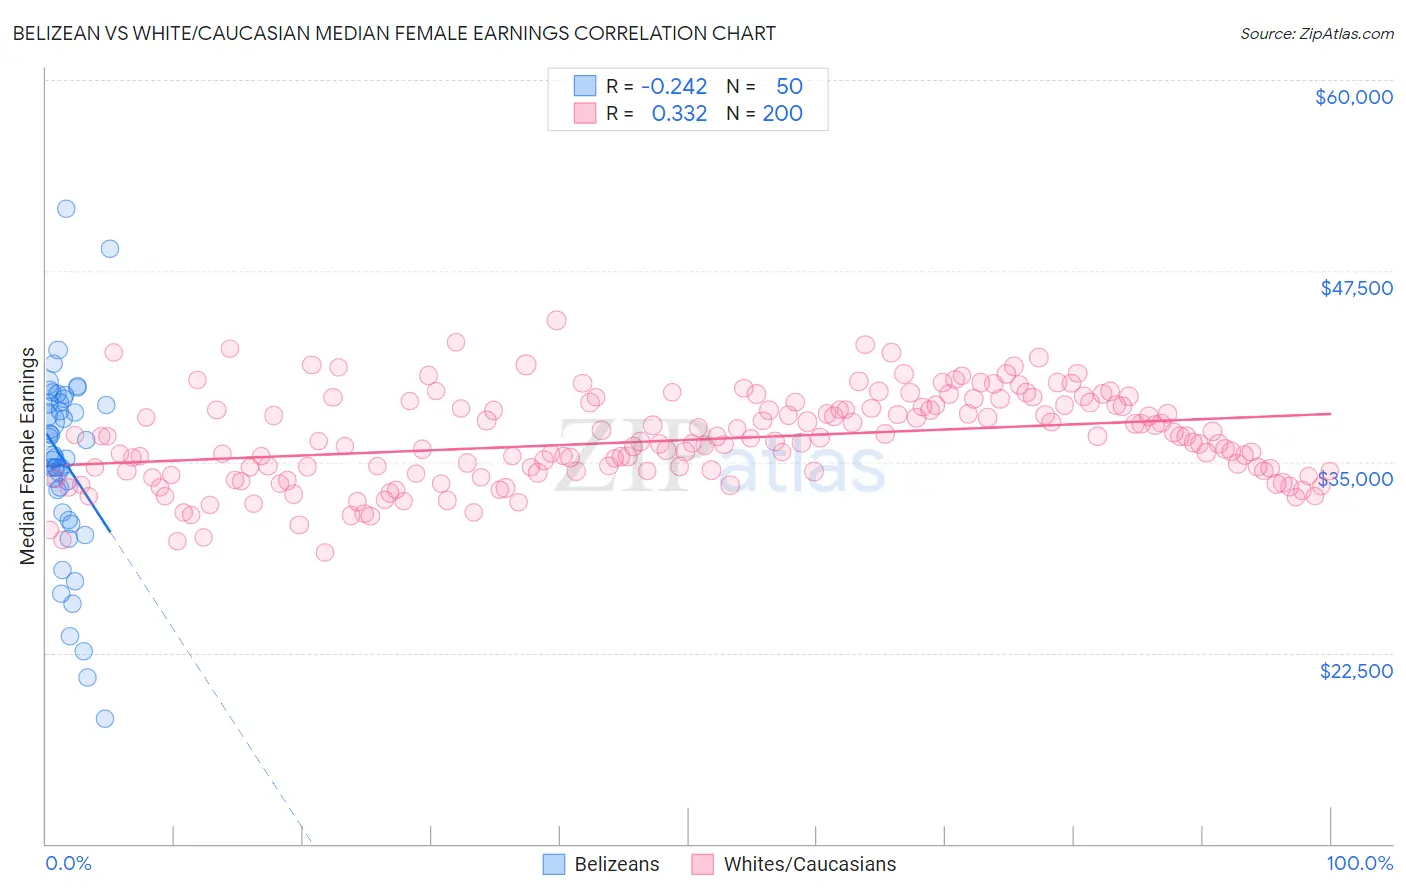
Belizean vs White/Caucasian Median Female Earnings Correlation Chart
The statistical analysis conducted on geographies consisting of 144,203,712 people shows a weak negative correlation between the proportion of Belizeans and median female earnings in the United States with a correlation coefficient (R) of -0.242 and weighted average of $37,429. Similarly, the statistical analysis conducted on geographies consisting of 581,839,033 people shows a mild positive correlation between the proportion of Whites/Caucasians and median female earnings in the United States with a correlation coefficient (R) of 0.332 and weighted average of $37,531, a difference of 0.27%.
Median Female Earnings Correlation Summary
| Measurement | Belizean | White/Caucasian |
| Minimum | $18,201 | $29,061 |
| Maximum | $51,565 | $44,249 |
| Range | $33,364 | $15,187 |
| Mean | $34,988 | $36,445 |
| Median | $35,337 | $36,298 |
| Interquartile 25% (IQ1) | $31,707 | $34,375 |
| Interquartile 75% (IQ3) | $38,920 | $38,681 |
| Interquartile Range (IQR) | $7,213 | $4,306 |
| Standard Deviation (Sample) | $6,353 | $2,956 |
| Standard Deviation (Population) | $6,289 | $2,949 |
Demographics Similar to Belizeans and Whites/Caucasians by Median Female Earnings
In terms of median female earnings, the demographic groups most similar to Belizeans are Scotch-Irish ($37,383, a difference of 0.12%), Hawaiian ($37,497, a difference of 0.18%), Samoan ($37,498, a difference of 0.19%), Colville ($37,514, a difference of 0.23%), and Dutch ($37,339, a difference of 0.24%). Similarly, the demographic groups most similar to Whites/Caucasians are Colville ($37,514, a difference of 0.040%), Samoan ($37,498, a difference of 0.090%), Hawaiian ($37,497, a difference of 0.090%), Scotch-Irish ($37,383, a difference of 0.39%), and Dutch ($37,339, a difference of 0.51%).
| Demographics | Rating | Rank | Median Female Earnings |
| Delaware | 2.6 /100 | #246 | Tragic $37,964 |
| Immigrants | Somalia | 2.4 /100 | #247 | Tragic $37,914 |
| Alaskan Athabascans | 2.3 /100 | #248 | Tragic $37,905 |
| Swiss | 2.3 /100 | #249 | Tragic $37,904 |
| Immigrants | Iraq | 2.2 /100 | #250 | Tragic $37,864 |
| Welsh | 2.1 /100 | #251 | Tragic $37,856 |
| Immigrants | Dominica | 2.0 /100 | #252 | Tragic $37,825 |
| Danes | 1.6 /100 | #253 | Tragic $37,730 |
| Whites/Caucasians | 1.1 /100 | #254 | Tragic $37,531 |
| Colville | 1.1 /100 | #255 | Tragic $37,514 |
| Samoans | 1.0 /100 | #256 | Tragic $37,498 |
| Hawaiians | 1.0 /100 | #257 | Tragic $37,497 |
| Belizeans | 0.9 /100 | #258 | Tragic $37,429 |
| Scotch-Irish | 0.8 /100 | #259 | Tragic $37,383 |
| Dutch | 0.7 /100 | #260 | Tragic $37,339 |
| Malaysians | 0.7 /100 | #261 | Tragic $37,298 |
| Venezuelans | 0.7 /100 | #262 | Tragic $37,282 |
| German Russians | 0.5 /100 | #263 | Tragic $37,105 |
| Salvadorans | 0.4 /100 | #264 | Tragic $37,083 |
| Immigrants | Belize | 0.4 /100 | #265 | Tragic $37,056 |
| Dominicans | 0.4 /100 | #266 | Tragic $37,046 |