Assyrian/Chaldean/Syriac vs Czechoslovakian Householder Income Over 65 years
COMPARE
Assyrian/Chaldean/Syriac
Czechoslovakian
Householder Income Over 65 years
Householder Income Over 65 years Comparison
Assyrians/Chaldeans/Syriacs
Czechoslovakians
$64,108
HOUSEHOLDER INCOME OVER 65 YEARS
96.4/ 100
METRIC RATING
99th/ 347
METRIC RANK
$60,581
HOUSEHOLDER INCOME OVER 65 YEARS
40.0/ 100
METRIC RATING
182nd/ 347
METRIC RANK
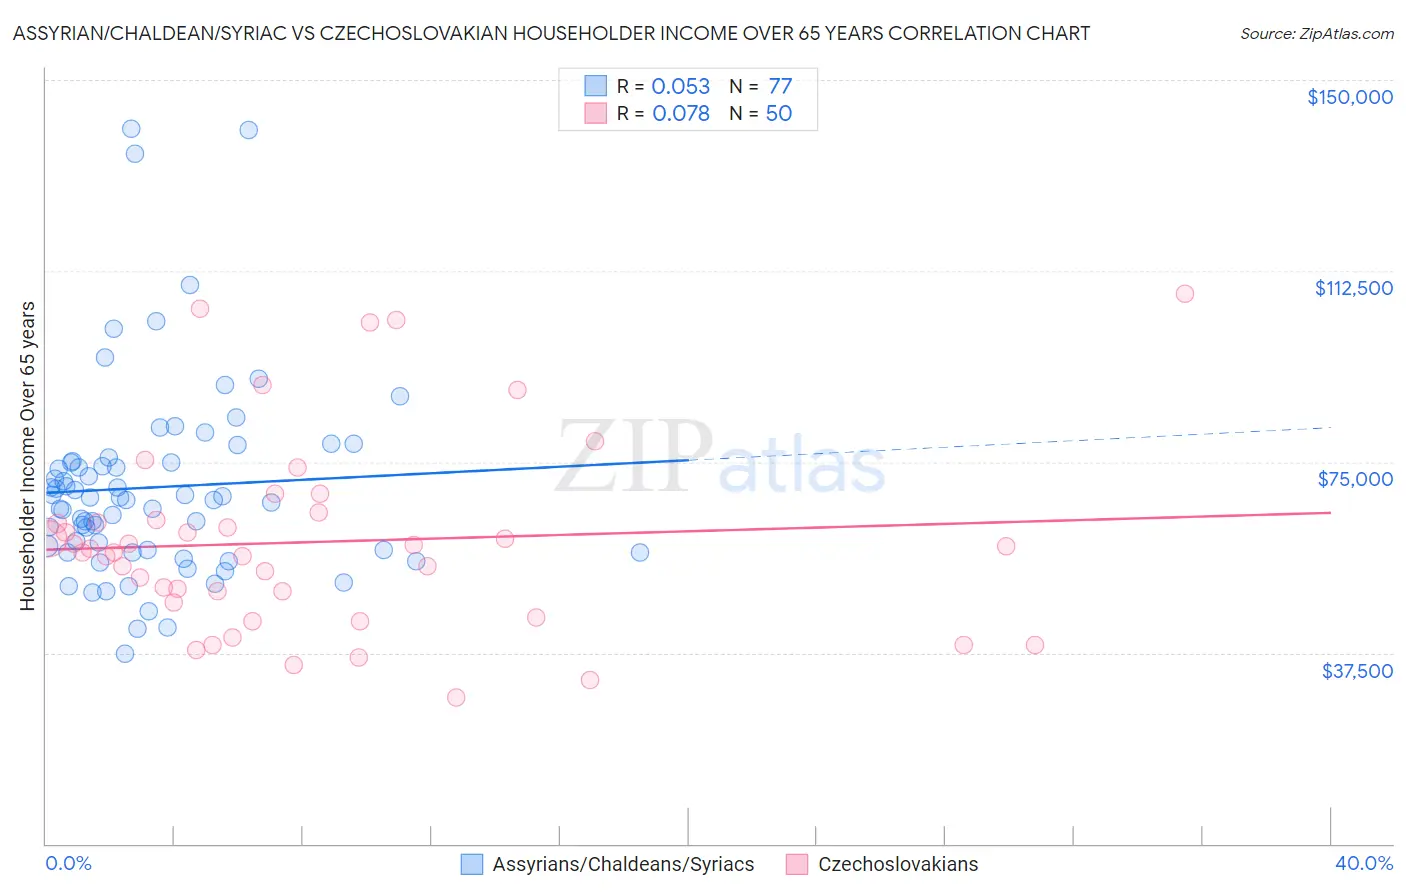
Assyrian/Chaldean/Syriac vs Czechoslovakian Householder Income Over 65 years Correlation Chart
The statistical analysis conducted on geographies consisting of 110,223,664 people shows a slight positive correlation between the proportion of Assyrians/Chaldeans/Syriacs and household income with householder over the age of 65 in the United States with a correlation coefficient (R) of 0.053 and weighted average of $64,108. Similarly, the statistical analysis conducted on geographies consisting of 367,841,442 people shows a slight positive correlation between the proportion of Czechoslovakians and household income with householder over the age of 65 in the United States with a correlation coefficient (R) of 0.078 and weighted average of $60,581, a difference of 5.8%.
Householder Income Over 65 years Correlation Summary
| Measurement | Assyrian/Chaldean/Syriac | Czechoslovakian |
| Minimum | $37,310 | $28,750 |
| Maximum | $140,431 | $108,125 |
| Range | $103,121 | $79,375 |
| Mean | $70,014 | $59,283 |
| Median | $67,459 | $57,534 |
| Interquartile 25% (IQ1) | $57,422 | $47,364 |
| Interquartile 75% (IQ3) | $75,038 | $63,539 |
| Interquartile Range (IQR) | $17,616 | $16,175 |
| Standard Deviation (Sample) | $19,596 | $18,822 |
| Standard Deviation (Population) | $19,468 | $18,633 |
Similar Demographics by Householder Income Over 65 years
Demographics Similar to Assyrians/Chaldeans/Syriacs by Householder Income Over 65 years
In terms of householder income over 65 years, the demographic groups most similar to Assyrians/Chaldeans/Syriacs are Immigrants from South Eastern Asia ($64,089, a difference of 0.030%), Romanian ($64,142, a difference of 0.050%), Immigrants from Italy ($64,065, a difference of 0.070%), Sri Lankan ($64,201, a difference of 0.14%), and Chilean ($63,957, a difference of 0.24%).
| Demographics | Rating | Rank | Householder Income Over 65 years |
| Immigrants | Bulgaria | 97.3 /100 | #92 | Exceptional $64,379 |
| Jordanians | 97.1 /100 | #93 | Exceptional $64,313 |
| Immigrants | Egypt | 97.0 /100 | #94 | Exceptional $64,299 |
| Immigrants | Latvia | 97.0 /100 | #95 | Exceptional $64,298 |
| Immigrants | Hungary | 97.0 /100 | #96 | Exceptional $64,277 |
| Sri Lankans | 96.7 /100 | #97 | Exceptional $64,201 |
| Romanians | 96.5 /100 | #98 | Exceptional $64,142 |
| Assyrians/Chaldeans/Syriacs | 96.4 /100 | #99 | Exceptional $64,108 |
| Immigrants | South Eastern Asia | 96.3 /100 | #100 | Exceptional $64,089 |
| Immigrants | Italy | 96.2 /100 | #101 | Exceptional $64,065 |
| Chileans | 95.8 /100 | #102 | Exceptional $63,957 |
| British | 95.7 /100 | #103 | Exceptional $63,940 |
| Immigrants | Cameroon | 95.6 /100 | #104 | Exceptional $63,907 |
| Italians | 95.5 /100 | #105 | Exceptional $63,885 |
| Immigrants | Argentina | 95.5 /100 | #106 | Exceptional $63,885 |
Demographics Similar to Czechoslovakians by Householder Income Over 65 years
In terms of householder income over 65 years, the demographic groups most similar to Czechoslovakians are Celtic ($60,608, a difference of 0.040%), Immigrants from Morocco ($60,647, a difference of 0.11%), Kenyan ($60,514, a difference of 0.11%), Welsh ($60,666, a difference of 0.14%), and Iraqi ($60,466, a difference of 0.19%).
| Demographics | Rating | Rank | Householder Income Over 65 years |
| Spaniards | 47.3 /100 | #175 | Average $60,866 |
| Spanish | 45.5 /100 | #176 | Average $60,795 |
| Alaska Natives | 44.3 /100 | #177 | Average $60,748 |
| Yup'ik | 43.7 /100 | #178 | Average $60,727 |
| Welsh | 42.2 /100 | #179 | Average $60,666 |
| Immigrants | Morocco | 41.7 /100 | #180 | Average $60,647 |
| Celtics | 40.7 /100 | #181 | Average $60,608 |
| Czechoslovakians | 40.0 /100 | #182 | Average $60,581 |
| Kenyans | 38.4 /100 | #183 | Fair $60,514 |
| Iraqis | 37.2 /100 | #184 | Fair $60,466 |
| Albanians | 32.0 /100 | #185 | Fair $60,249 |
| Slovenes | 31.8 /100 | #186 | Fair $60,241 |
| Immigrants | Thailand | 31.3 /100 | #187 | Fair $60,217 |
| Immigrants | Eritrea | 28.6 /100 | #188 | Fair $60,096 |
| Ghanaians | 27.5 /100 | #189 | Fair $60,043 |