Assyrian/Chaldean/Syriac vs Immigrants from Central America Householder Income Over 65 years
COMPARE
Assyrian/Chaldean/Syriac
Immigrants from Central America
Householder Income Over 65 years
Householder Income Over 65 years Comparison
Assyrians/Chaldeans/Syriacs
Immigrants from Central America
$64,108
HOUSEHOLDER INCOME OVER 65 YEARS
96.4/ 100
METRIC RATING
99th/ 347
METRIC RANK
$53,420
HOUSEHOLDER INCOME OVER 65 YEARS
0.0/ 100
METRIC RATING
295th/ 347
METRIC RANK
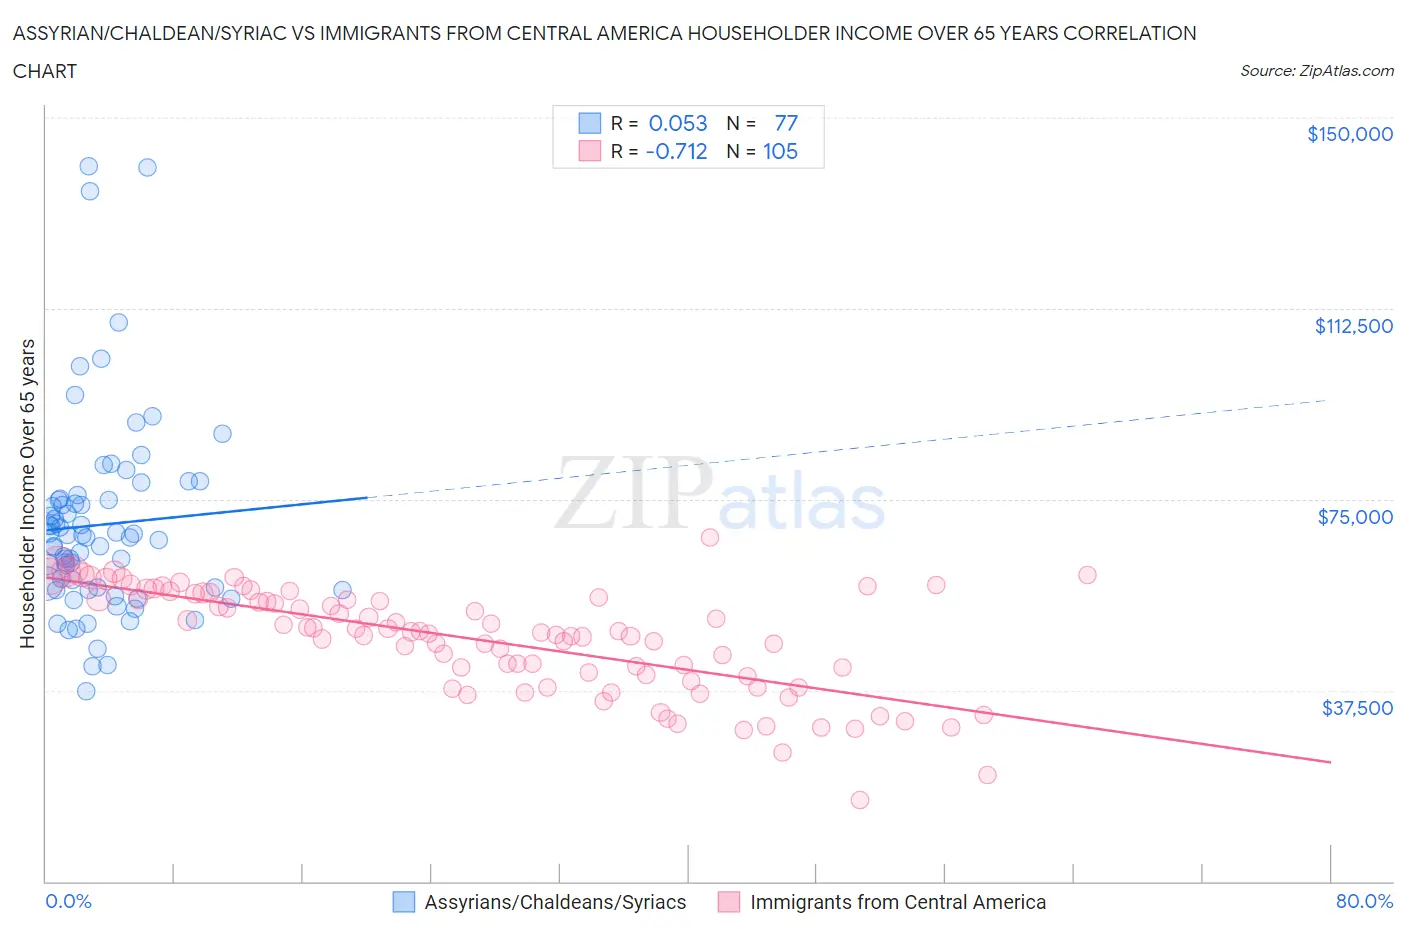
Assyrian/Chaldean/Syriac vs Immigrants from Central America Householder Income Over 65 years Correlation Chart
The statistical analysis conducted on geographies consisting of 110,223,664 people shows a slight positive correlation between the proportion of Assyrians/Chaldeans/Syriacs and household income with householder over the age of 65 in the United States with a correlation coefficient (R) of 0.053 and weighted average of $64,108. Similarly, the statistical analysis conducted on geographies consisting of 532,367,827 people shows a strong negative correlation between the proportion of Immigrants from Central America and household income with householder over the age of 65 in the United States with a correlation coefficient (R) of -0.712 and weighted average of $53,420, a difference of 20.0%.
Householder Income Over 65 years Correlation Summary
| Measurement | Assyrian/Chaldean/Syriac | Immigrants from Central America |
| Minimum | $37,310 | $16,002 |
| Maximum | $140,431 | $67,589 |
| Range | $103,121 | $51,587 |
| Mean | $70,014 | $47,469 |
| Median | $67,459 | $48,994 |
| Interquartile 25% (IQ1) | $57,422 | $40,316 |
| Interquartile 75% (IQ3) | $75,038 | $56,072 |
| Interquartile Range (IQR) | $17,616 | $15,755 |
| Standard Deviation (Sample) | $19,596 | $10,330 |
| Standard Deviation (Population) | $19,468 | $10,281 |
Similar Demographics by Householder Income Over 65 years
Demographics Similar to Assyrians/Chaldeans/Syriacs by Householder Income Over 65 years
In terms of householder income over 65 years, the demographic groups most similar to Assyrians/Chaldeans/Syriacs are Immigrants from South Eastern Asia ($64,089, a difference of 0.030%), Romanian ($64,142, a difference of 0.050%), Immigrants from Italy ($64,065, a difference of 0.070%), Sri Lankan ($64,201, a difference of 0.14%), and Chilean ($63,957, a difference of 0.24%).
| Demographics | Rating | Rank | Householder Income Over 65 years |
| Immigrants | Bulgaria | 97.3 /100 | #92 | Exceptional $64,379 |
| Jordanians | 97.1 /100 | #93 | Exceptional $64,313 |
| Immigrants | Egypt | 97.0 /100 | #94 | Exceptional $64,299 |
| Immigrants | Latvia | 97.0 /100 | #95 | Exceptional $64,298 |
| Immigrants | Hungary | 97.0 /100 | #96 | Exceptional $64,277 |
| Sri Lankans | 96.7 /100 | #97 | Exceptional $64,201 |
| Romanians | 96.5 /100 | #98 | Exceptional $64,142 |
| Assyrians/Chaldeans/Syriacs | 96.4 /100 | #99 | Exceptional $64,108 |
| Immigrants | South Eastern Asia | 96.3 /100 | #100 | Exceptional $64,089 |
| Immigrants | Italy | 96.2 /100 | #101 | Exceptional $64,065 |
| Chileans | 95.8 /100 | #102 | Exceptional $63,957 |
| British | 95.7 /100 | #103 | Exceptional $63,940 |
| Immigrants | Cameroon | 95.6 /100 | #104 | Exceptional $63,907 |
| Italians | 95.5 /100 | #105 | Exceptional $63,885 |
| Immigrants | Argentina | 95.5 /100 | #106 | Exceptional $63,885 |
Demographics Similar to Immigrants from Central America by Householder Income Over 65 years
In terms of householder income over 65 years, the demographic groups most similar to Immigrants from Central America are Immigrants from Somalia ($53,333, a difference of 0.16%), Immigrants from Latin America ($53,265, a difference of 0.29%), Senegalese ($53,591, a difference of 0.32%), Central American Indian ($53,232, a difference of 0.35%), and Ottawa ($53,217, a difference of 0.38%).
| Demographics | Rating | Rank | Householder Income Over 65 years |
| Paiute | 0.1 /100 | #288 | Tragic $53,762 |
| Iroquois | 0.1 /100 | #289 | Tragic $53,737 |
| Chickasaw | 0.1 /100 | #290 | Tragic $53,732 |
| Africans | 0.0 /100 | #291 | Tragic $53,711 |
| Shoshone | 0.0 /100 | #292 | Tragic $53,681 |
| Immigrants | Belize | 0.0 /100 | #293 | Tragic $53,665 |
| Senegalese | 0.0 /100 | #294 | Tragic $53,591 |
| Immigrants | Central America | 0.0 /100 | #295 | Tragic $53,420 |
| Immigrants | Somalia | 0.0 /100 | #296 | Tragic $53,333 |
| Immigrants | Latin America | 0.0 /100 | #297 | Tragic $53,265 |
| Central American Indians | 0.0 /100 | #298 | Tragic $53,232 |
| Ottawa | 0.0 /100 | #299 | Tragic $53,217 |
| Immigrants | Bahamas | 0.0 /100 | #300 | Tragic $53,174 |
| Yuman | 0.0 /100 | #301 | Tragic $53,110 |
| Spanish American Indians | 0.0 /100 | #302 | Tragic $53,077 |