Assyrian/Chaldean/Syriac vs Scottish Householder Income Over 65 years
COMPARE
Assyrian/Chaldean/Syriac
Scottish
Householder Income Over 65 years
Householder Income Over 65 years Comparison
Assyrians/Chaldeans/Syriacs
Scottish
$64,108
HOUSEHOLDER INCOME OVER 65 YEARS
96.4/ 100
METRIC RATING
99th/ 347
METRIC RANK
$61,735
HOUSEHOLDER INCOME OVER 65 YEARS
69.1/ 100
METRIC RATING
149th/ 347
METRIC RANK
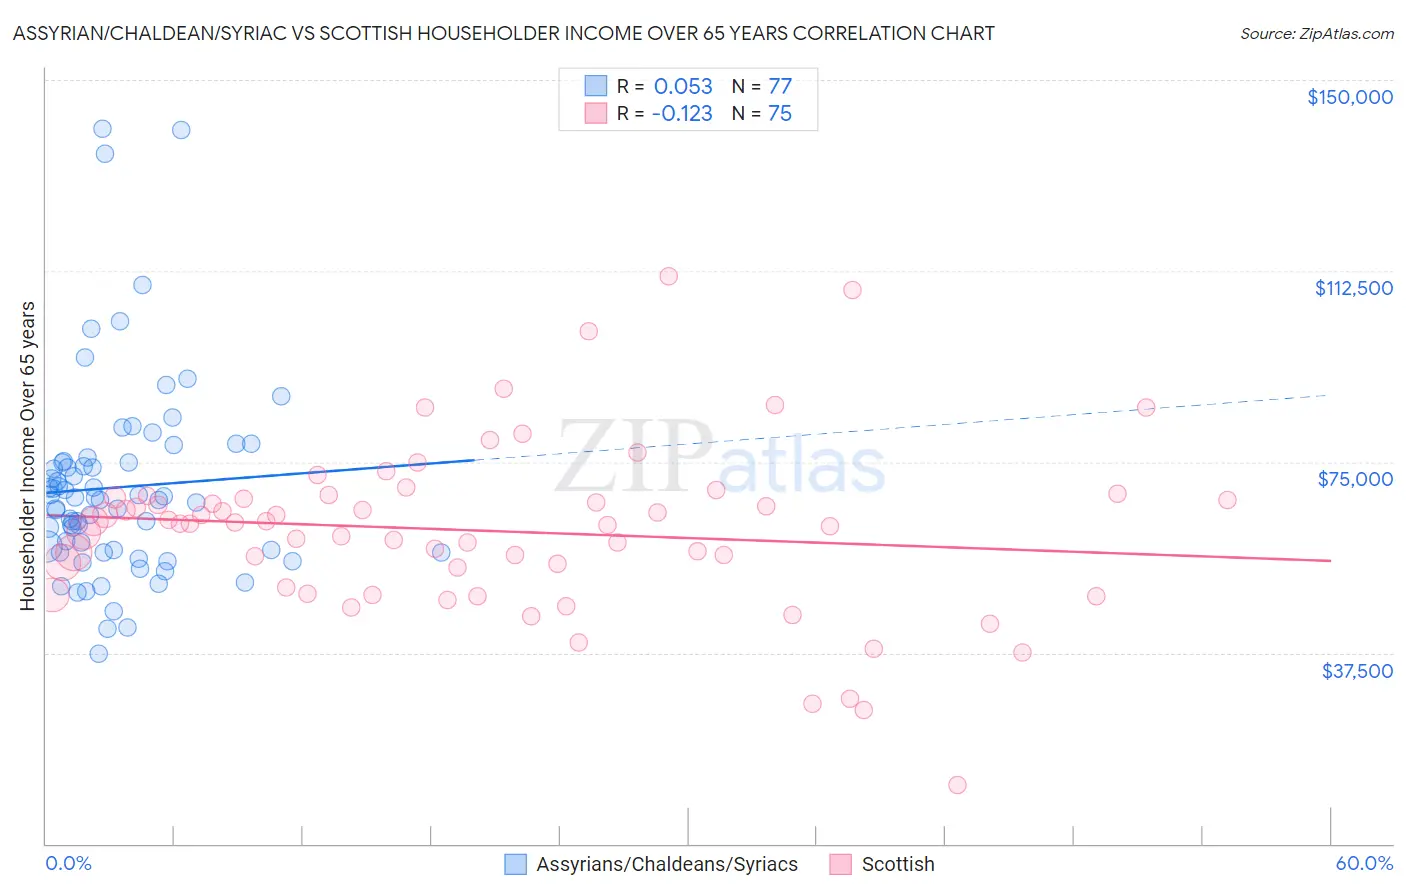
Assyrian/Chaldean/Syriac vs Scottish Householder Income Over 65 years Correlation Chart
The statistical analysis conducted on geographies consisting of 110,223,664 people shows a slight positive correlation between the proportion of Assyrians/Chaldeans/Syriacs and household income with householder over the age of 65 in the United States with a correlation coefficient (R) of 0.053 and weighted average of $64,108. Similarly, the statistical analysis conducted on geographies consisting of 561,942,660 people shows a poor negative correlation between the proportion of Scottish and household income with householder over the age of 65 in the United States with a correlation coefficient (R) of -0.123 and weighted average of $61,735, a difference of 3.8%.
Householder Income Over 65 years Correlation Summary
| Measurement | Assyrian/Chaldean/Syriac | Scottish |
| Minimum | $37,310 | $11,480 |
| Maximum | $140,431 | $111,394 |
| Range | $103,121 | $99,914 |
| Mean | $70,014 | $61,439 |
| Median | $67,459 | $62,867 |
| Interquartile 25% (IQ1) | $57,422 | $50,429 |
| Interquartile 75% (IQ3) | $75,038 | $67,901 |
| Interquartile Range (IQR) | $17,616 | $17,472 |
| Standard Deviation (Sample) | $19,596 | $16,892 |
| Standard Deviation (Population) | $19,468 | $16,779 |
Similar Demographics by Householder Income Over 65 years
Demographics Similar to Assyrians/Chaldeans/Syriacs by Householder Income Over 65 years
In terms of householder income over 65 years, the demographic groups most similar to Assyrians/Chaldeans/Syriacs are Immigrants from South Eastern Asia ($64,089, a difference of 0.030%), Romanian ($64,142, a difference of 0.050%), Immigrants from Italy ($64,065, a difference of 0.070%), Sri Lankan ($64,201, a difference of 0.14%), and Chilean ($63,957, a difference of 0.24%).
| Demographics | Rating | Rank | Householder Income Over 65 years |
| Immigrants | Bulgaria | 97.3 /100 | #92 | Exceptional $64,379 |
| Jordanians | 97.1 /100 | #93 | Exceptional $64,313 |
| Immigrants | Egypt | 97.0 /100 | #94 | Exceptional $64,299 |
| Immigrants | Latvia | 97.0 /100 | #95 | Exceptional $64,298 |
| Immigrants | Hungary | 97.0 /100 | #96 | Exceptional $64,277 |
| Sri Lankans | 96.7 /100 | #97 | Exceptional $64,201 |
| Romanians | 96.5 /100 | #98 | Exceptional $64,142 |
| Assyrians/Chaldeans/Syriacs | 96.4 /100 | #99 | Exceptional $64,108 |
| Immigrants | South Eastern Asia | 96.3 /100 | #100 | Exceptional $64,089 |
| Immigrants | Italy | 96.2 /100 | #101 | Exceptional $64,065 |
| Chileans | 95.8 /100 | #102 | Exceptional $63,957 |
| British | 95.7 /100 | #103 | Exceptional $63,940 |
| Immigrants | Cameroon | 95.6 /100 | #104 | Exceptional $63,907 |
| Italians | 95.5 /100 | #105 | Exceptional $63,885 |
| Immigrants | Argentina | 95.5 /100 | #106 | Exceptional $63,885 |
Demographics Similar to Scottish by Householder Income Over 65 years
In terms of householder income over 65 years, the demographic groups most similar to Scottish are Slavic ($61,709, a difference of 0.040%), Alsatian ($61,797, a difference of 0.10%), Hungarian ($61,673, a difference of 0.10%), Armenian ($61,656, a difference of 0.13%), and Costa Rican ($61,638, a difference of 0.16%).
| Demographics | Rating | Rank | Householder Income Over 65 years |
| South American Indians | 78.7 /100 | #142 | Good $62,215 |
| Immigrants | Belarus | 77.8 /100 | #143 | Good $62,162 |
| Immigrants | Peru | 74.4 /100 | #144 | Good $61,988 |
| Immigrants | Uganda | 74.2 /100 | #145 | Good $61,976 |
| Immigrants | Southern Europe | 72.7 /100 | #146 | Good $61,902 |
| Immigrants | Nepal | 71.4 /100 | #147 | Good $61,843 |
| Alsatians | 70.5 /100 | #148 | Good $61,797 |
| Scottish | 69.1 /100 | #149 | Good $61,735 |
| Slavs | 68.5 /100 | #150 | Good $61,709 |
| Hungarians | 67.7 /100 | #151 | Good $61,673 |
| Armenians | 67.3 /100 | #152 | Good $61,656 |
| Costa Ricans | 66.9 /100 | #153 | Good $61,638 |
| Swiss | 66.5 /100 | #154 | Good $61,621 |
| Poles | 65.9 /100 | #155 | Good $61,598 |
| Scandinavians | 65.6 /100 | #156 | Good $61,586 |