Assyrian/Chaldean/Syriac vs Tongan Householder Income Over 65 years
COMPARE
Assyrian/Chaldean/Syriac
Tongan
Householder Income Over 65 years
Householder Income Over 65 years Comparison
Assyrians/Chaldeans/Syriacs
Tongans
$64,108
HOUSEHOLDER INCOME OVER 65 YEARS
96.4/ 100
METRIC RATING
99th/ 347
METRIC RANK
$68,235
HOUSEHOLDER INCOME OVER 65 YEARS
100.0/ 100
METRIC RATING
35th/ 347
METRIC RANK
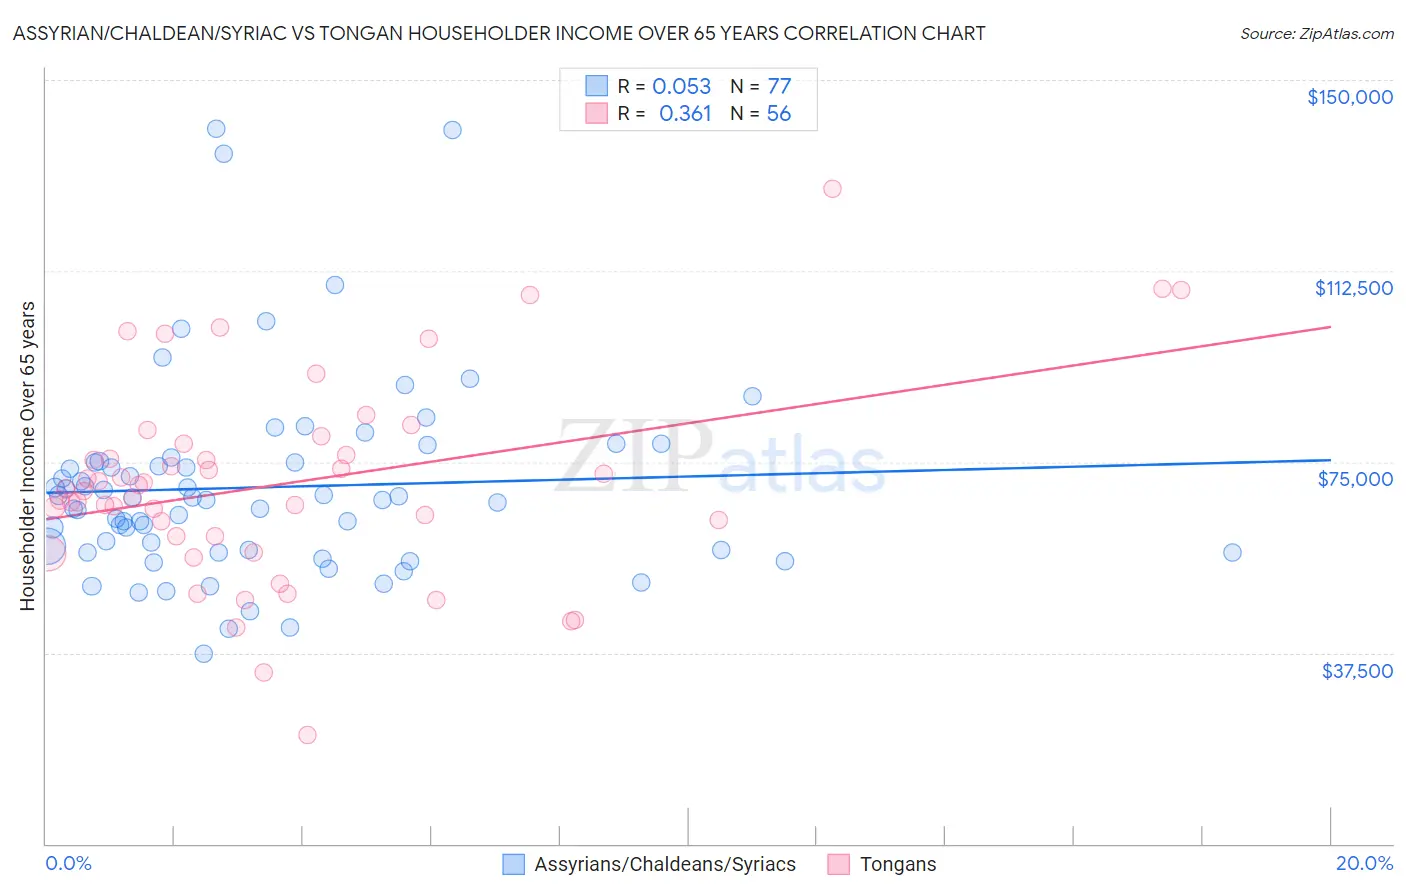
Assyrian/Chaldean/Syriac vs Tongan Householder Income Over 65 years Correlation Chart
The statistical analysis conducted on geographies consisting of 110,223,664 people shows a slight positive correlation between the proportion of Assyrians/Chaldeans/Syriacs and household income with householder over the age of 65 in the United States with a correlation coefficient (R) of 0.053 and weighted average of $64,108. Similarly, the statistical analysis conducted on geographies consisting of 102,743,666 people shows a mild positive correlation between the proportion of Tongans and household income with householder over the age of 65 in the United States with a correlation coefficient (R) of 0.361 and weighted average of $68,235, a difference of 6.4%.
Householder Income Over 65 years Correlation Summary
| Measurement | Assyrian/Chaldean/Syriac | Tongan |
| Minimum | $37,310 | $21,272 |
| Maximum | $140,431 | $128,750 |
| Range | $103,121 | $107,478 |
| Mean | $70,014 | $70,695 |
| Median | $67,459 | $69,480 |
| Interquartile 25% (IQ1) | $57,422 | $60,415 |
| Interquartile 75% (IQ3) | $75,038 | $77,410 |
| Interquartile Range (IQR) | $17,616 | $16,995 |
| Standard Deviation (Sample) | $19,596 | $19,925 |
| Standard Deviation (Population) | $19,468 | $19,746 |
Similar Demographics by Householder Income Over 65 years
Demographics Similar to Assyrians/Chaldeans/Syriacs by Householder Income Over 65 years
In terms of householder income over 65 years, the demographic groups most similar to Assyrians/Chaldeans/Syriacs are Immigrants from South Eastern Asia ($64,089, a difference of 0.030%), Romanian ($64,142, a difference of 0.050%), Immigrants from Italy ($64,065, a difference of 0.070%), Sri Lankan ($64,201, a difference of 0.14%), and Chilean ($63,957, a difference of 0.24%).
| Demographics | Rating | Rank | Householder Income Over 65 years |
| Immigrants | Bulgaria | 97.3 /100 | #92 | Exceptional $64,379 |
| Jordanians | 97.1 /100 | #93 | Exceptional $64,313 |
| Immigrants | Egypt | 97.0 /100 | #94 | Exceptional $64,299 |
| Immigrants | Latvia | 97.0 /100 | #95 | Exceptional $64,298 |
| Immigrants | Hungary | 97.0 /100 | #96 | Exceptional $64,277 |
| Sri Lankans | 96.7 /100 | #97 | Exceptional $64,201 |
| Romanians | 96.5 /100 | #98 | Exceptional $64,142 |
| Assyrians/Chaldeans/Syriacs | 96.4 /100 | #99 | Exceptional $64,108 |
| Immigrants | South Eastern Asia | 96.3 /100 | #100 | Exceptional $64,089 |
| Immigrants | Italy | 96.2 /100 | #101 | Exceptional $64,065 |
| Chileans | 95.8 /100 | #102 | Exceptional $63,957 |
| British | 95.7 /100 | #103 | Exceptional $63,940 |
| Immigrants | Cameroon | 95.6 /100 | #104 | Exceptional $63,907 |
| Italians | 95.5 /100 | #105 | Exceptional $63,885 |
| Immigrants | Argentina | 95.5 /100 | #106 | Exceptional $63,885 |
Demographics Similar to Tongans by Householder Income Over 65 years
In terms of householder income over 65 years, the demographic groups most similar to Tongans are Immigrants from Austria ($68,208, a difference of 0.040%), Turkish ($68,037, a difference of 0.29%), Immigrants from Ireland ($68,495, a difference of 0.38%), Estonian ($67,926, a difference of 0.46%), and Immigrants from Denmark ($68,801, a difference of 0.83%).
| Demographics | Rating | Rank | Householder Income Over 65 years |
| Immigrants | China | 100.0 /100 | #28 | Exceptional $69,174 |
| Immigrants | Australia | 100.0 /100 | #29 | Exceptional $69,164 |
| Immigrants | Northern Europe | 100.0 /100 | #30 | Exceptional $69,003 |
| Afghans | 100.0 /100 | #31 | Exceptional $68,951 |
| Asians | 100.0 /100 | #32 | Exceptional $68,822 |
| Immigrants | Denmark | 100.0 /100 | #33 | Exceptional $68,801 |
| Immigrants | Ireland | 100.0 /100 | #34 | Exceptional $68,495 |
| Tongans | 100.0 /100 | #35 | Exceptional $68,235 |
| Immigrants | Austria | 99.9 /100 | #36 | Exceptional $68,208 |
| Turks | 99.9 /100 | #37 | Exceptional $68,037 |
| Estonians | 99.9 /100 | #38 | Exceptional $67,926 |
| Russians | 99.9 /100 | #39 | Exceptional $67,626 |
| Immigrants | Asia | 99.9 /100 | #40 | Exceptional $67,594 |
| Koreans | 99.9 /100 | #41 | Exceptional $67,472 |
| New Zealanders | 99.9 /100 | #42 | Exceptional $67,333 |