Assyrian/Chaldean/Syriac vs Immigrants from Egypt Householder Income Over 65 years
COMPARE
Assyrian/Chaldean/Syriac
Immigrants from Egypt
Householder Income Over 65 years
Householder Income Over 65 years Comparison
Assyrians/Chaldeans/Syriacs
Immigrants from Egypt
$64,108
HOUSEHOLDER INCOME OVER 65 YEARS
96.4/ 100
METRIC RATING
99th/ 347
METRIC RANK
$64,299
HOUSEHOLDER INCOME OVER 65 YEARS
97.0/ 100
METRIC RATING
94th/ 347
METRIC RANK
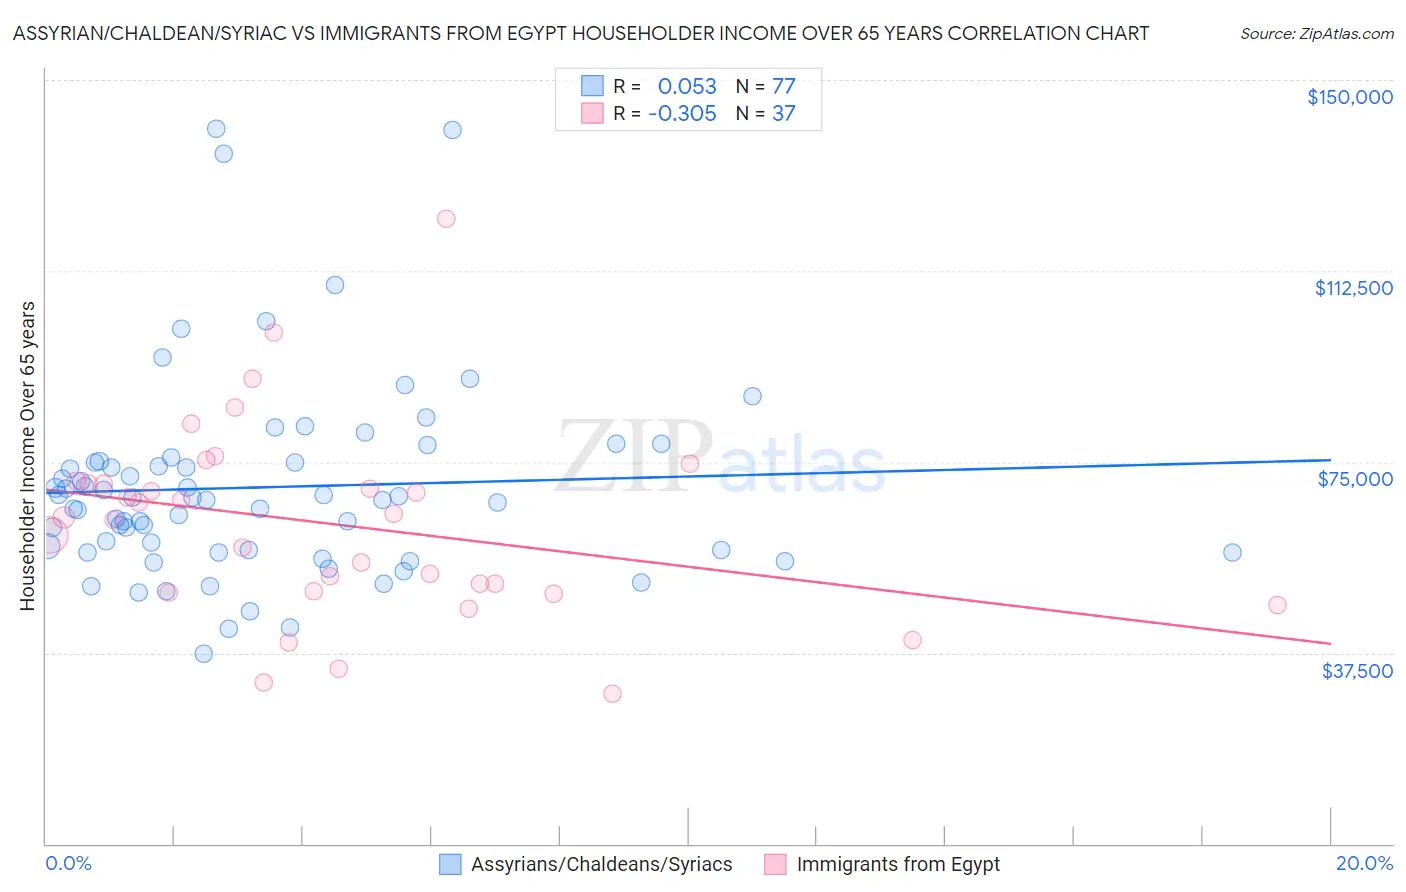
Assyrian/Chaldean/Syriac vs Immigrants from Egypt Householder Income Over 65 years Correlation Chart
The statistical analysis conducted on geographies consisting of 110,223,664 people shows a slight positive correlation between the proportion of Assyrians/Chaldeans/Syriacs and household income with householder over the age of 65 in the United States with a correlation coefficient (R) of 0.053 and weighted average of $64,108. Similarly, the statistical analysis conducted on geographies consisting of 245,155,858 people shows a mild negative correlation between the proportion of Immigrants from Egypt and household income with householder over the age of 65 in the United States with a correlation coefficient (R) of -0.305 and weighted average of $64,299, a difference of 0.30%.
Householder Income Over 65 years Correlation Summary
| Measurement | Assyrian/Chaldean/Syriac | Immigrants from Egypt |
| Minimum | $37,310 | $29,535 |
| Maximum | $140,431 | $122,712 |
| Range | $103,121 | $93,177 |
| Mean | $70,014 | $62,777 |
| Median | $67,459 | $64,167 |
| Interquartile 25% (IQ1) | $57,422 | $49,457 |
| Interquartile 75% (IQ3) | $75,038 | $71,003 |
| Interquartile Range (IQR) | $17,616 | $21,547 |
| Standard Deviation (Sample) | $19,596 | $19,130 |
| Standard Deviation (Population) | $19,468 | $18,869 |
Demographics Similar to Assyrians/Chaldeans/Syriacs and Immigrants from Egypt by Householder Income Over 65 years
In terms of householder income over 65 years, the demographic groups most similar to Assyrians/Chaldeans/Syriacs are Immigrants from South Eastern Asia ($64,089, a difference of 0.030%), Romanian ($64,142, a difference of 0.050%), Immigrants from Italy ($64,065, a difference of 0.070%), Sri Lankan ($64,201, a difference of 0.14%), and Chilean ($63,957, a difference of 0.24%). Similarly, the demographic groups most similar to Immigrants from Egypt are Immigrants from Latvia ($64,298, a difference of 0.0%), Jordanian ($64,313, a difference of 0.020%), Immigrants from Hungary ($64,277, a difference of 0.030%), Immigrants from Bulgaria ($64,379, a difference of 0.13%), and Sri Lankan ($64,201, a difference of 0.15%).
| Demographics | Rating | Rank | Householder Income Over 65 years |
| Immigrants | Russia | 97.6 /100 | #86 | Exceptional $64,512 |
| Austrians | 97.5 /100 | #87 | Exceptional $64,470 |
| Immigrants | Romania | 97.5 /100 | #88 | Exceptional $64,462 |
| Paraguayans | 97.4 /100 | #89 | Exceptional $64,443 |
| Immigrants | Kuwait | 97.4 /100 | #90 | Exceptional $64,433 |
| Immigrants | Oceania | 97.4 /100 | #91 | Exceptional $64,416 |
| Immigrants | Bulgaria | 97.3 /100 | #92 | Exceptional $64,379 |
| Jordanians | 97.1 /100 | #93 | Exceptional $64,313 |
| Immigrants | Egypt | 97.0 /100 | #94 | Exceptional $64,299 |
| Immigrants | Latvia | 97.0 /100 | #95 | Exceptional $64,298 |
| Immigrants | Hungary | 97.0 /100 | #96 | Exceptional $64,277 |
| Sri Lankans | 96.7 /100 | #97 | Exceptional $64,201 |
| Romanians | 96.5 /100 | #98 | Exceptional $64,142 |
| Assyrians/Chaldeans/Syriacs | 96.4 /100 | #99 | Exceptional $64,108 |
| Immigrants | South Eastern Asia | 96.3 /100 | #100 | Exceptional $64,089 |
| Immigrants | Italy | 96.2 /100 | #101 | Exceptional $64,065 |
| Chileans | 95.8 /100 | #102 | Exceptional $63,957 |
| British | 95.7 /100 | #103 | Exceptional $63,940 |
| Immigrants | Cameroon | 95.6 /100 | #104 | Exceptional $63,907 |
| Italians | 95.5 /100 | #105 | Exceptional $63,885 |
| Immigrants | Argentina | 95.5 /100 | #106 | Exceptional $63,885 |