Assyrian/Chaldean/Syriac vs Crow Self-Care Disability
COMPARE
Assyrian/Chaldean/Syriac
Crow
Self-Care Disability
Self-Care Disability Comparison
Assyrians/Chaldeans/Syriacs
Crow
2.8%
SELF-CARE DISABILITY
0.0/ 100
METRIC RATING
318th/ 347
METRIC RANK
2.5%
SELF-CARE DISABILITY
15.2/ 100
METRIC RATING
197th/ 347
METRIC RANK
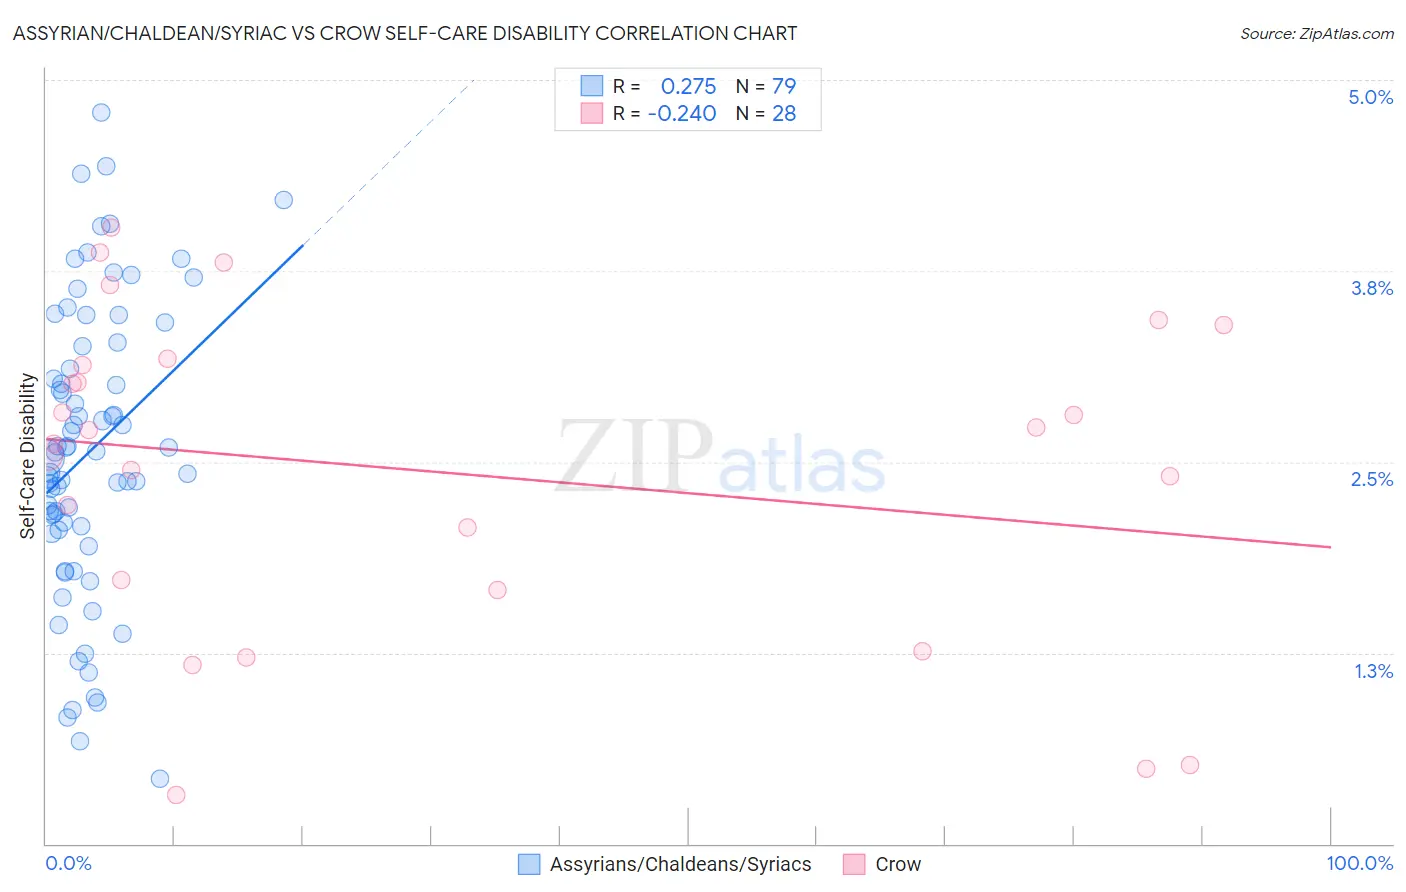
Assyrian/Chaldean/Syriac vs Crow Self-Care Disability Correlation Chart
The statistical analysis conducted on geographies consisting of 110,250,746 people shows a weak positive correlation between the proportion of Assyrians/Chaldeans/Syriacs and percentage of population with self-care disability in the United States with a correlation coefficient (R) of 0.275 and weighted average of 2.8%. Similarly, the statistical analysis conducted on geographies consisting of 59,179,234 people shows a weak negative correlation between the proportion of Crow and percentage of population with self-care disability in the United States with a correlation coefficient (R) of -0.240 and weighted average of 2.5%, a difference of 13.2%.
Self-Care Disability Correlation Summary
| Measurement | Assyrian/Chaldean/Syriac | Crow |
| Minimum | 0.43% | 0.32% |
| Maximum | 4.8% | 4.0% |
| Range | 4.4% | 3.7% |
| Mean | 2.6% | 2.4% |
| Median | 2.6% | 2.7% |
| Interquartile 25% (IQ1) | 2.1% | 1.7% |
| Interquartile 75% (IQ3) | 3.3% | 3.2% |
| Interquartile Range (IQR) | 1.2% | 1.5% |
| Standard Deviation (Sample) | 0.95% | 1.1% |
| Standard Deviation (Population) | 0.94% | 1.0% |
Similar Demographics by Self-Care Disability
Demographics Similar to Assyrians/Chaldeans/Syriacs by Self-Care Disability
In terms of self-care disability, the demographic groups most similar to Assyrians/Chaldeans/Syriacs are Immigrants from Dominica (2.8%, a difference of 0.010%), Menominee (2.8%, a difference of 0.14%), Spanish American Indian (2.9%, a difference of 0.16%), Immigrants from Cuba (2.8%, a difference of 0.24%), and Chickasaw (2.9%, a difference of 0.37%).
| Demographics | Rating | Rank | Self-Care Disability |
| Puget Sound Salish | 0.0 /100 | #311 | Tragic 2.8% |
| Immigrants | Caribbean | 0.0 /100 | #312 | Tragic 2.8% |
| Spanish Americans | 0.0 /100 | #313 | Tragic 2.8% |
| Creek | 0.0 /100 | #314 | Tragic 2.8% |
| Immigrants | Cuba | 0.0 /100 | #315 | Tragic 2.8% |
| Menominee | 0.0 /100 | #316 | Tragic 2.8% |
| Immigrants | Dominica | 0.0 /100 | #317 | Tragic 2.8% |
| Assyrians/Chaldeans/Syriacs | 0.0 /100 | #318 | Tragic 2.8% |
| Spanish American Indians | 0.0 /100 | #319 | Tragic 2.9% |
| Chickasaw | 0.0 /100 | #320 | Tragic 2.9% |
| Navajo | 0.0 /100 | #321 | Tragic 2.9% |
| Comanche | 0.0 /100 | #322 | Tragic 2.9% |
| Seminole | 0.0 /100 | #323 | Tragic 2.9% |
| Cherokee | 0.0 /100 | #324 | Tragic 2.9% |
| Immigrants | Uzbekistan | 0.0 /100 | #325 | Tragic 2.9% |
Demographics Similar to Crow by Self-Care Disability
In terms of self-care disability, the demographic groups most similar to Crow are Immigrants (2.5%, a difference of 0.020%), Immigrants from Southern Europe (2.5%, a difference of 0.030%), Korean (2.5%, a difference of 0.030%), Immigrants from Ghana (2.5%, a difference of 0.050%), and Immigrants from Western Africa (2.5%, a difference of 0.19%).
| Demographics | Rating | Rank | Self-Care Disability |
| Sioux | 24.6 /100 | #190 | Fair 2.5% |
| Moroccans | 22.9 /100 | #191 | Fair 2.5% |
| Soviet Union | 22.2 /100 | #192 | Fair 2.5% |
| Ukrainians | 21.4 /100 | #193 | Fair 2.5% |
| Immigrants | Germany | 17.9 /100 | #194 | Poor 2.5% |
| Immigrants | Southern Europe | 15.6 /100 | #195 | Poor 2.5% |
| Koreans | 15.5 /100 | #196 | Poor 2.5% |
| Crow | 15.2 /100 | #197 | Poor 2.5% |
| Immigrants | Immigrants | 15.0 /100 | #198 | Poor 2.5% |
| Immigrants | Ghana | 14.7 /100 | #199 | Poor 2.5% |
| Immigrants | Western Africa | 13.3 /100 | #200 | Poor 2.5% |
| Immigrants | South Eastern Asia | 12.9 /100 | #201 | Poor 2.5% |
| Slovaks | 12.6 /100 | #202 | Poor 2.5% |
| Immigrants | Lebanon | 12.4 /100 | #203 | Poor 2.5% |
| Immigrants | Bahamas | 11.9 /100 | #204 | Poor 2.5% |