Asian vs Immigrants from Serbia Median Household Income
COMPARE
Asian
Immigrants from Serbia
Median Household Income
Median Household Income Comparison
Asians
Immigrants from Serbia
$101,681
MEDIAN HOUSEHOLD INCOME
100.0/ 100
METRIC RATING
22nd/ 347
METRIC RANK
$91,730
MEDIAN HOUSEHOLD INCOME
98.6/ 100
METRIC RATING
97th/ 347
METRIC RANK
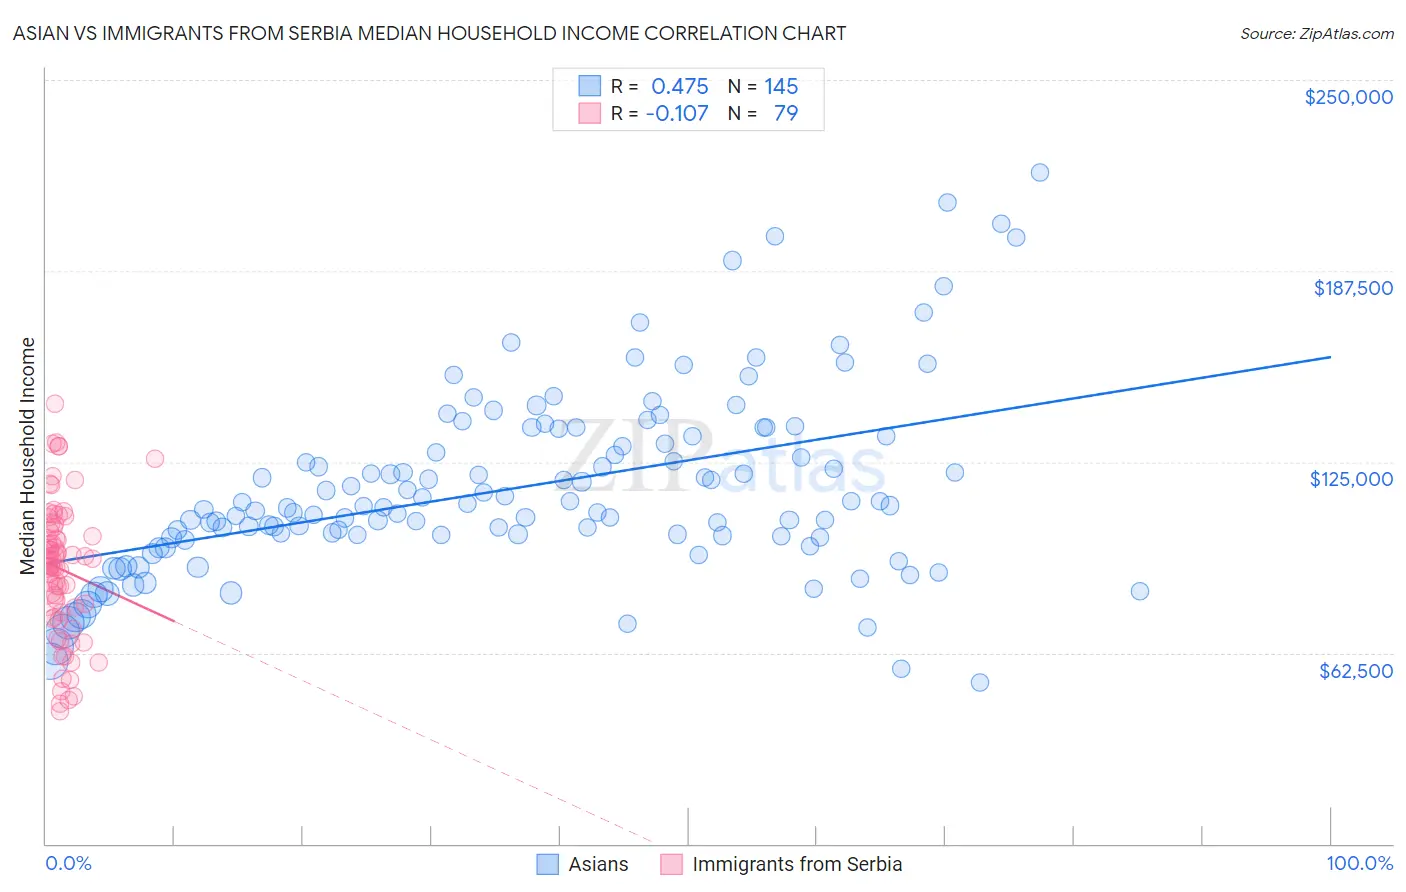
Asian vs Immigrants from Serbia Median Household Income Correlation Chart
The statistical analysis conducted on geographies consisting of 549,980,753 people shows a moderate positive correlation between the proportion of Asians and median household income in the United States with a correlation coefficient (R) of 0.475 and weighted average of $101,681. Similarly, the statistical analysis conducted on geographies consisting of 131,713,671 people shows a poor negative correlation between the proportion of Immigrants from Serbia and median household income in the United States with a correlation coefficient (R) of -0.107 and weighted average of $91,730, a difference of 10.8%.
Median Household Income Correlation Summary
| Measurement | Asian | Immigrants from Serbia |
| Minimum | $52,658 | $43,214 |
| Maximum | $219,913 | $143,885 |
| Range | $167,255 | $100,671 |
| Mean | $116,419 | $89,961 |
| Median | $110,126 | $92,273 |
| Interquartile 25% (IQ1) | $100,433 | $75,804 |
| Interquartile 75% (IQ3) | $133,482 | $103,357 |
| Interquartile Range (IQR) | $33,049 | $27,553 |
| Standard Deviation (Sample) | $30,496 | $22,012 |
| Standard Deviation (Population) | $30,391 | $21,872 |
Similar Demographics by Median Household Income
Demographics Similar to Asians by Median Household Income
In terms of median household income, the demographic groups most similar to Asians are Eastern European ($101,781, a difference of 0.10%), Immigrants from Bolivia ($101,394, a difference of 0.28%), Bolivian ($102,195, a difference of 0.50%), Immigrants from Australia ($102,562, a difference of 0.87%), and Immigrants from Japan ($100,711, a difference of 0.96%).
| Demographics | Rating | Rank | Median Household Income |
| Immigrants | Israel | 100.0 /100 | #15 | Exceptional $104,090 |
| Burmese | 100.0 /100 | #16 | Exceptional $103,145 |
| Immigrants | Korea | 100.0 /100 | #17 | Exceptional $102,962 |
| Cypriots | 100.0 /100 | #18 | Exceptional $102,843 |
| Immigrants | Australia | 100.0 /100 | #19 | Exceptional $102,562 |
| Bolivians | 100.0 /100 | #20 | Exceptional $102,195 |
| Eastern Europeans | 100.0 /100 | #21 | Exceptional $101,781 |
| Asians | 100.0 /100 | #22 | Exceptional $101,681 |
| Immigrants | Bolivia | 100.0 /100 | #23 | Exceptional $101,394 |
| Immigrants | Japan | 100.0 /100 | #24 | Exceptional $100,711 |
| Immigrants | Sweden | 100.0 /100 | #25 | Exceptional $100,699 |
| Immigrants | Belgium | 100.0 /100 | #26 | Exceptional $100,306 |
| Bhutanese | 100.0 /100 | #27 | Exceptional $100,151 |
| Immigrants | Sri Lanka | 100.0 /100 | #28 | Exceptional $99,943 |
| Immigrants | Asia | 100.0 /100 | #29 | Exceptional $99,933 |
Demographics Similar to Immigrants from Serbia by Median Household Income
In terms of median household income, the demographic groups most similar to Immigrants from Serbia are Jordanian ($91,794, a difference of 0.070%), Armenian ($91,807, a difference of 0.080%), Immigrants from North America ($91,860, a difference of 0.14%), Immigrants from Southern Europe ($91,605, a difference of 0.14%), and Immigrants from Lebanon ($91,887, a difference of 0.17%).
| Demographics | Rating | Rank | Median Household Income |
| Assyrians/Chaldeans/Syriacs | 98.8 /100 | #90 | Exceptional $91,991 |
| Immigrants | Vietnam | 98.8 /100 | #91 | Exceptional $91,987 |
| Immigrants | Western Europe | 98.8 /100 | #92 | Exceptional $91,936 |
| Immigrants | Lebanon | 98.7 /100 | #93 | Exceptional $91,887 |
| Immigrants | North America | 98.7 /100 | #94 | Exceptional $91,860 |
| Armenians | 98.7 /100 | #95 | Exceptional $91,807 |
| Jordanians | 98.7 /100 | #96 | Exceptional $91,794 |
| Immigrants | Serbia | 98.6 /100 | #97 | Exceptional $91,730 |
| Immigrants | Southern Europe | 98.5 /100 | #98 | Exceptional $91,605 |
| Immigrants | South Eastern Asia | 98.4 /100 | #99 | Exceptional $91,541 |
| Ukrainians | 98.3 /100 | #100 | Exceptional $91,456 |
| Immigrants | Moldova | 98.3 /100 | #101 | Exceptional $91,446 |
| Austrians | 98.2 /100 | #102 | Exceptional $91,339 |
| Immigrants | Ukraine | 98.0 /100 | #103 | Exceptional $91,124 |
| Immigrants | Kazakhstan | 97.8 /100 | #104 | Exceptional $91,015 |