Asian vs Immigrants from Turkey Median Household Income
COMPARE
Asian
Immigrants from Turkey
Median Household Income
Median Household Income Comparison
Asians
Immigrants from Turkey
$101,681
MEDIAN HOUSEHOLD INCOME
100.0/ 100
METRIC RATING
22nd/ 347
METRIC RANK
$96,964
MEDIAN HOUSEHOLD INCOME
100.0/ 100
METRIC RATING
41st/ 347
METRIC RANK
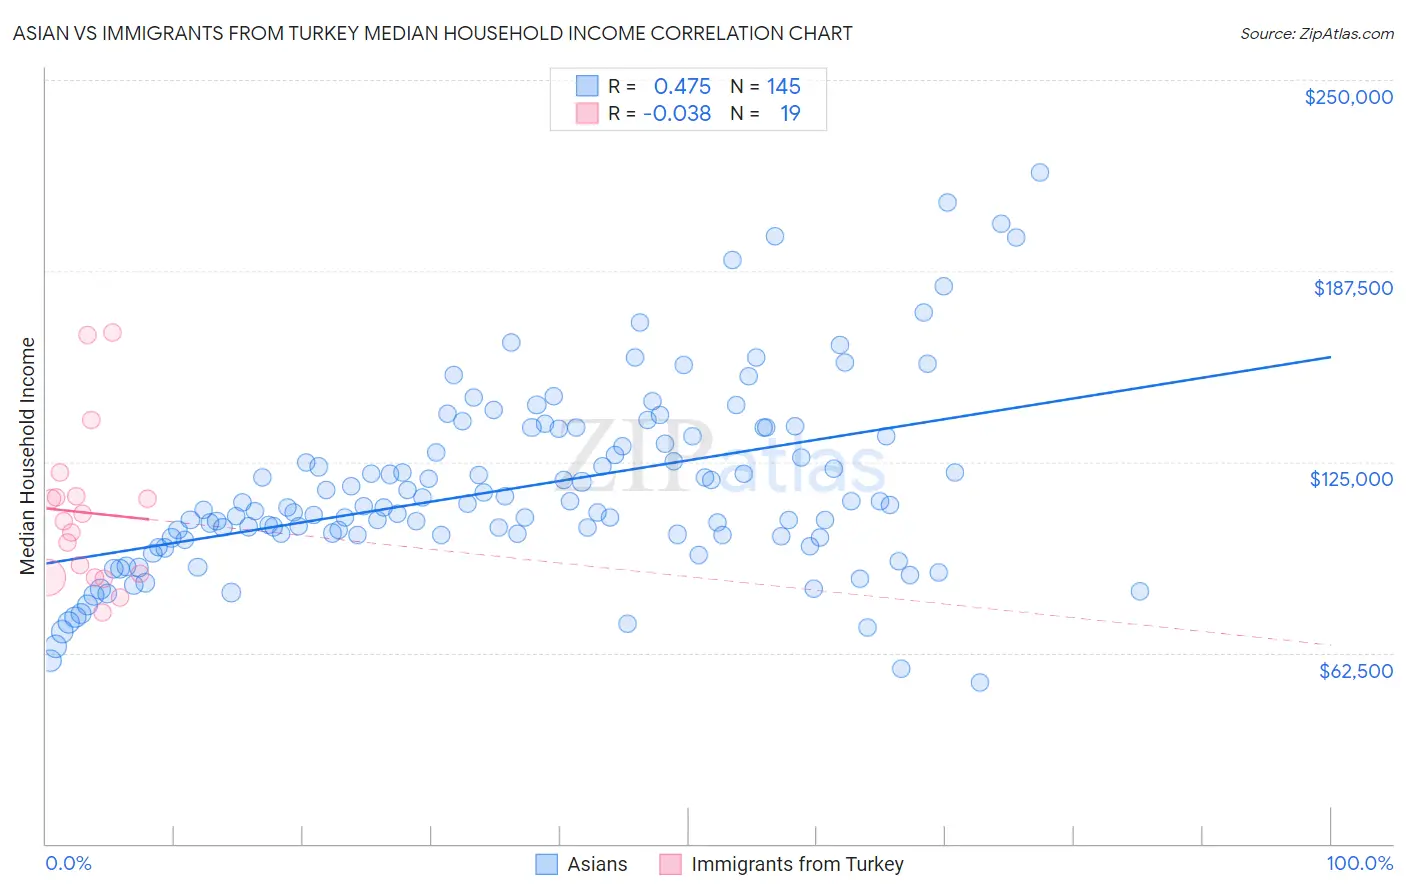
Asian vs Immigrants from Turkey Median Household Income Correlation Chart
The statistical analysis conducted on geographies consisting of 549,980,753 people shows a moderate positive correlation between the proportion of Asians and median household income in the United States with a correlation coefficient (R) of 0.475 and weighted average of $101,681. Similarly, the statistical analysis conducted on geographies consisting of 222,938,856 people shows no correlation between the proportion of Immigrants from Turkey and median household income in the United States with a correlation coefficient (R) of -0.038 and weighted average of $96,964, a difference of 4.9%.
Median Household Income Correlation Summary
| Measurement | Asian | Immigrants from Turkey |
| Minimum | $52,658 | $75,893 |
| Maximum | $219,913 | $167,317 |
| Range | $167,255 | $91,424 |
| Mean | $116,419 | $108,335 |
| Median | $110,126 | $105,608 |
| Interquartile 25% (IQ1) | $100,433 | $87,245 |
| Interquartile 75% (IQ3) | $133,482 | $113,867 |
| Interquartile Range (IQR) | $33,049 | $26,622 |
| Standard Deviation (Sample) | $30,496 | $25,883 |
| Standard Deviation (Population) | $30,391 | $25,193 |
Demographics Similar to Asians and Immigrants from Turkey by Median Household Income
In terms of median household income, the demographic groups most similar to Asians are Eastern European ($101,781, a difference of 0.10%), Immigrants from Bolivia ($101,394, a difference of 0.28%), Immigrants from Japan ($100,711, a difference of 0.96%), Immigrants from Sweden ($100,699, a difference of 0.98%), and Immigrants from Belgium ($100,306, a difference of 1.4%). Similarly, the demographic groups most similar to Immigrants from Turkey are Maltese ($97,015, a difference of 0.050%), Afghan ($97,026, a difference of 0.060%), Immigrants from Indonesia ($97,297, a difference of 0.34%), Latvian ($97,311, a difference of 0.36%), and Immigrants from Pakistan ($97,528, a difference of 0.58%).
| Demographics | Rating | Rank | Median Household Income |
| Eastern Europeans | 100.0 /100 | #21 | Exceptional $101,781 |
| Asians | 100.0 /100 | #22 | Exceptional $101,681 |
| Immigrants | Bolivia | 100.0 /100 | #23 | Exceptional $101,394 |
| Immigrants | Japan | 100.0 /100 | #24 | Exceptional $100,711 |
| Immigrants | Sweden | 100.0 /100 | #25 | Exceptional $100,699 |
| Immigrants | Belgium | 100.0 /100 | #26 | Exceptional $100,306 |
| Bhutanese | 100.0 /100 | #27 | Exceptional $100,151 |
| Immigrants | Sri Lanka | 100.0 /100 | #28 | Exceptional $99,943 |
| Immigrants | Asia | 100.0 /100 | #29 | Exceptional $99,933 |
| Immigrants | Northern Europe | 100.0 /100 | #30 | Exceptional $99,813 |
| Turks | 100.0 /100 | #31 | Exceptional $99,389 |
| Immigrants | Denmark | 100.0 /100 | #32 | Exceptional $98,510 |
| Chinese | 100.0 /100 | #33 | Exceptional $98,496 |
| Russians | 100.0 /100 | #34 | Exceptional $98,008 |
| Immigrants | Switzerland | 100.0 /100 | #35 | Exceptional $97,979 |
| Immigrants | Pakistan | 100.0 /100 | #36 | Exceptional $97,528 |
| Latvians | 100.0 /100 | #37 | Exceptional $97,311 |
| Immigrants | Indonesia | 100.0 /100 | #38 | Exceptional $97,297 |
| Afghans | 100.0 /100 | #39 | Exceptional $97,026 |
| Maltese | 100.0 /100 | #40 | Exceptional $97,015 |
| Immigrants | Turkey | 100.0 /100 | #41 | Exceptional $96,964 |