Australian vs Immigrants from Serbia Median Household Income
COMPARE
Australian
Immigrants from Serbia
Median Household Income
Median Household Income Comparison
Australians
Immigrants from Serbia
$96,490
MEDIAN HOUSEHOLD INCOME
99.9/ 100
METRIC RATING
46th/ 347
METRIC RANK
$91,730
MEDIAN HOUSEHOLD INCOME
98.6/ 100
METRIC RATING
97th/ 347
METRIC RANK
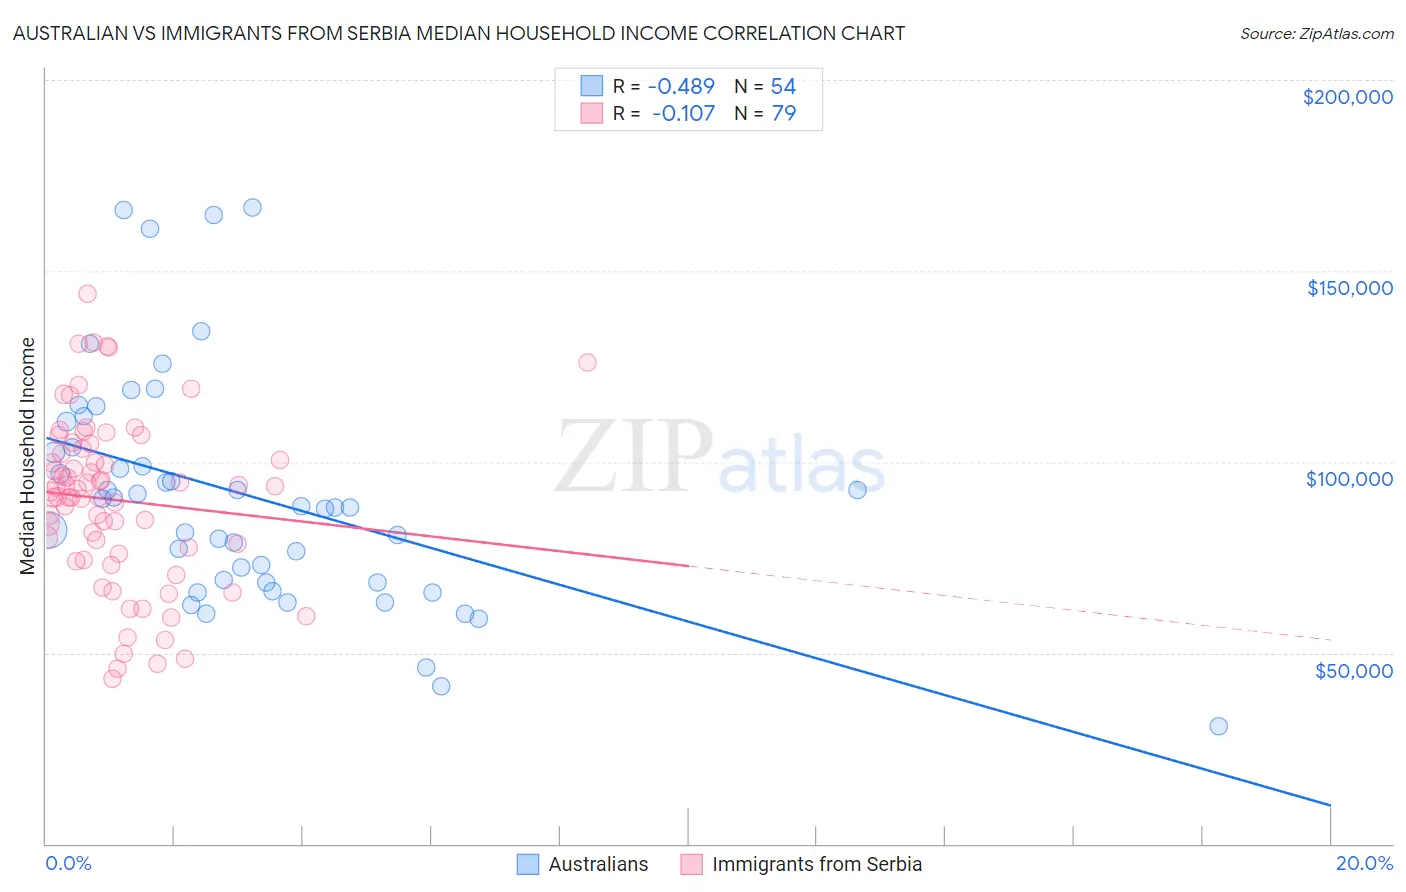
Australian vs Immigrants from Serbia Median Household Income Correlation Chart
The statistical analysis conducted on geographies consisting of 223,978,576 people shows a moderate negative correlation between the proportion of Australians and median household income in the United States with a correlation coefficient (R) of -0.489 and weighted average of $96,490. Similarly, the statistical analysis conducted on geographies consisting of 131,713,671 people shows a poor negative correlation between the proportion of Immigrants from Serbia and median household income in the United States with a correlation coefficient (R) of -0.107 and weighted average of $91,730, a difference of 5.2%.
Median Household Income Correlation Summary
| Measurement | Australian | Immigrants from Serbia |
| Minimum | $30,714 | $43,214 |
| Maximum | $166,528 | $143,885 |
| Range | $135,814 | $100,671 |
| Mean | $91,180 | $89,961 |
| Median | $88,142 | $92,273 |
| Interquartile 25% (IQ1) | $68,506 | $75,804 |
| Interquartile 75% (IQ3) | $103,837 | $103,357 |
| Interquartile Range (IQR) | $35,331 | $27,553 |
| Standard Deviation (Sample) | $30,330 | $22,012 |
| Standard Deviation (Population) | $30,047 | $21,872 |
Similar Demographics by Median Household Income
Demographics Similar to Australians by Median Household Income
In terms of median household income, the demographic groups most similar to Australians are Israeli ($96,552, a difference of 0.060%), Immigrants from Russia ($96,378, a difference of 0.12%), Cambodian ($96,324, a difference of 0.17%), Immigrants from Greece ($96,675, a difference of 0.19%), and Immigrants from Malaysia ($96,292, a difference of 0.21%).
| Demographics | Rating | Rank | Median Household Income |
| Afghans | 100.0 /100 | #39 | Exceptional $97,026 |
| Maltese | 100.0 /100 | #40 | Exceptional $97,015 |
| Immigrants | Turkey | 100.0 /100 | #41 | Exceptional $96,964 |
| Immigrants | Lithuania | 99.9 /100 | #42 | Exceptional $96,836 |
| Immigrants | France | 99.9 /100 | #43 | Exceptional $96,743 |
| Immigrants | Greece | 99.9 /100 | #44 | Exceptional $96,675 |
| Israelis | 99.9 /100 | #45 | Exceptional $96,552 |
| Australians | 99.9 /100 | #46 | Exceptional $96,490 |
| Immigrants | Russia | 99.9 /100 | #47 | Exceptional $96,378 |
| Cambodians | 99.9 /100 | #48 | Exceptional $96,324 |
| Immigrants | Malaysia | 99.9 /100 | #49 | Exceptional $96,292 |
| Bulgarians | 99.9 /100 | #50 | Exceptional $96,290 |
| Estonians | 99.9 /100 | #51 | Exceptional $95,930 |
| Immigrants | South Africa | 99.9 /100 | #52 | Exceptional $95,800 |
| Paraguayans | 99.9 /100 | #53 | Exceptional $95,737 |
Demographics Similar to Immigrants from Serbia by Median Household Income
In terms of median household income, the demographic groups most similar to Immigrants from Serbia are Jordanian ($91,794, a difference of 0.070%), Armenian ($91,807, a difference of 0.080%), Immigrants from North America ($91,860, a difference of 0.14%), Immigrants from Southern Europe ($91,605, a difference of 0.14%), and Immigrants from Lebanon ($91,887, a difference of 0.17%).
| Demographics | Rating | Rank | Median Household Income |
| Assyrians/Chaldeans/Syriacs | 98.8 /100 | #90 | Exceptional $91,991 |
| Immigrants | Vietnam | 98.8 /100 | #91 | Exceptional $91,987 |
| Immigrants | Western Europe | 98.8 /100 | #92 | Exceptional $91,936 |
| Immigrants | Lebanon | 98.7 /100 | #93 | Exceptional $91,887 |
| Immigrants | North America | 98.7 /100 | #94 | Exceptional $91,860 |
| Armenians | 98.7 /100 | #95 | Exceptional $91,807 |
| Jordanians | 98.7 /100 | #96 | Exceptional $91,794 |
| Immigrants | Serbia | 98.6 /100 | #97 | Exceptional $91,730 |
| Immigrants | Southern Europe | 98.5 /100 | #98 | Exceptional $91,605 |
| Immigrants | South Eastern Asia | 98.4 /100 | #99 | Exceptional $91,541 |
| Ukrainians | 98.3 /100 | #100 | Exceptional $91,456 |
| Immigrants | Moldova | 98.3 /100 | #101 | Exceptional $91,446 |
| Austrians | 98.2 /100 | #102 | Exceptional $91,339 |
| Immigrants | Ukraine | 98.0 /100 | #103 | Exceptional $91,124 |
| Immigrants | Kazakhstan | 97.8 /100 | #104 | Exceptional $91,015 |