Cambodian vs Immigrants from Serbia Median Household Income
COMPARE
Cambodian
Immigrants from Serbia
Median Household Income
Median Household Income Comparison
Cambodians
Immigrants from Serbia
$96,324
MEDIAN HOUSEHOLD INCOME
99.9/ 100
METRIC RATING
48th/ 347
METRIC RANK
$91,730
MEDIAN HOUSEHOLD INCOME
98.6/ 100
METRIC RATING
97th/ 347
METRIC RANK
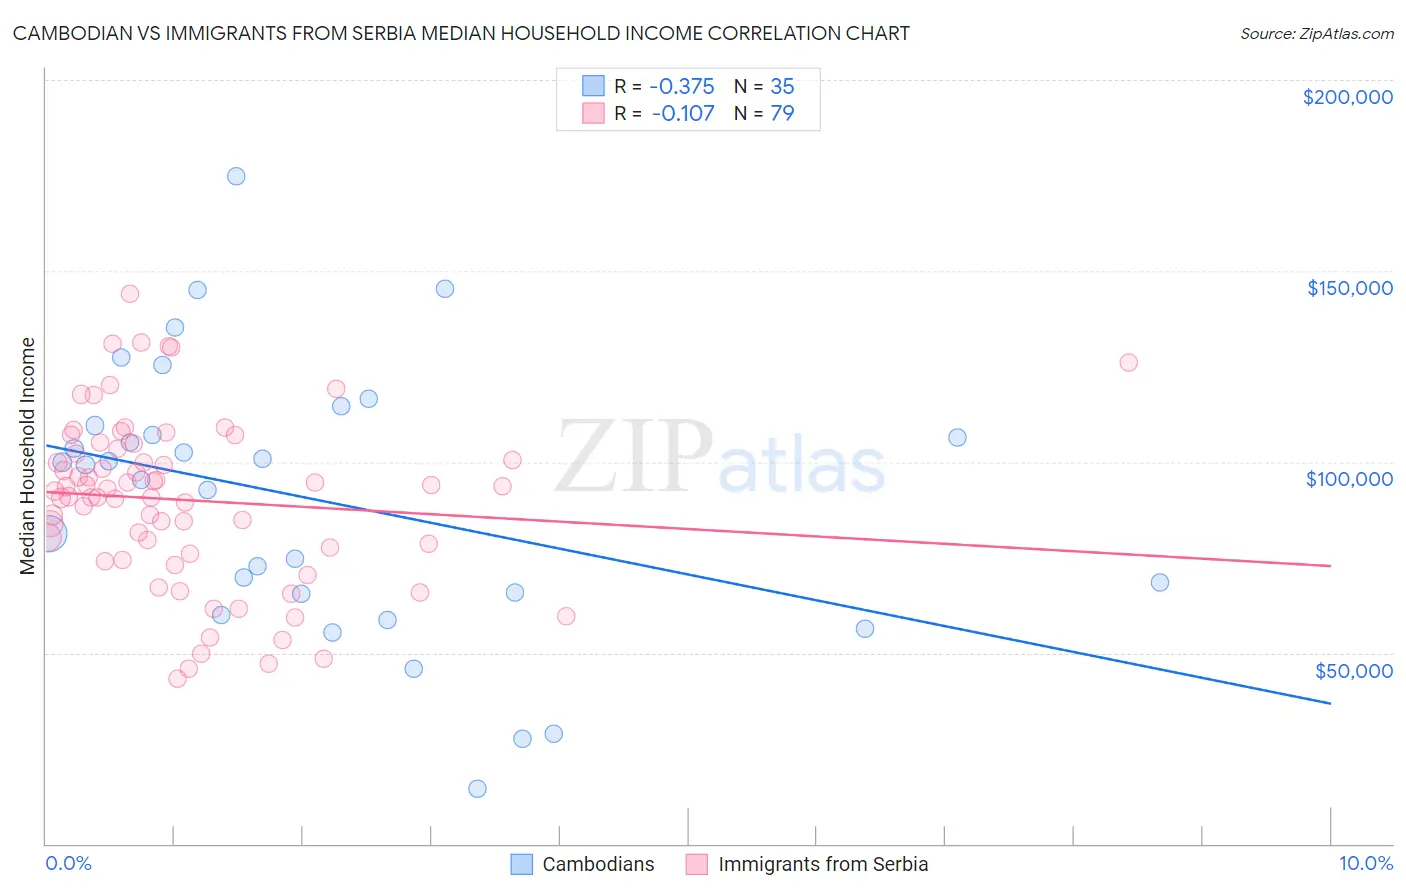
Cambodian vs Immigrants from Serbia Median Household Income Correlation Chart
The statistical analysis conducted on geographies consisting of 102,460,584 people shows a mild negative correlation between the proportion of Cambodians and median household income in the United States with a correlation coefficient (R) of -0.375 and weighted average of $96,324. Similarly, the statistical analysis conducted on geographies consisting of 131,713,671 people shows a poor negative correlation between the proportion of Immigrants from Serbia and median household income in the United States with a correlation coefficient (R) of -0.107 and weighted average of $91,730, a difference of 5.0%.
Median Household Income Correlation Summary
| Measurement | Cambodian | Immigrants from Serbia |
| Minimum | $14,319 | $43,214 |
| Maximum | $174,929 | $143,885 |
| Range | $160,610 | $100,671 |
| Mean | $90,039 | $89,961 |
| Median | $99,162 | $92,273 |
| Interquartile 25% (IQ1) | $65,313 | $75,804 |
| Interquartile 75% (IQ3) | $109,510 | $103,357 |
| Interquartile Range (IQR) | $44,197 | $27,553 |
| Standard Deviation (Sample) | $35,802 | $22,012 |
| Standard Deviation (Population) | $35,287 | $21,872 |
Similar Demographics by Median Household Income
Demographics Similar to Cambodians by Median Household Income
In terms of median household income, the demographic groups most similar to Cambodians are Immigrants from Malaysia ($96,292, a difference of 0.030%), Bulgarian ($96,290, a difference of 0.040%), Immigrants from Russia ($96,378, a difference of 0.060%), Australian ($96,490, a difference of 0.17%), and Israeli ($96,552, a difference of 0.24%).
| Demographics | Rating | Rank | Median Household Income |
| Immigrants | Turkey | 100.0 /100 | #41 | Exceptional $96,964 |
| Immigrants | Lithuania | 99.9 /100 | #42 | Exceptional $96,836 |
| Immigrants | France | 99.9 /100 | #43 | Exceptional $96,743 |
| Immigrants | Greece | 99.9 /100 | #44 | Exceptional $96,675 |
| Israelis | 99.9 /100 | #45 | Exceptional $96,552 |
| Australians | 99.9 /100 | #46 | Exceptional $96,490 |
| Immigrants | Russia | 99.9 /100 | #47 | Exceptional $96,378 |
| Cambodians | 99.9 /100 | #48 | Exceptional $96,324 |
| Immigrants | Malaysia | 99.9 /100 | #49 | Exceptional $96,292 |
| Bulgarians | 99.9 /100 | #50 | Exceptional $96,290 |
| Estonians | 99.9 /100 | #51 | Exceptional $95,930 |
| Immigrants | South Africa | 99.9 /100 | #52 | Exceptional $95,800 |
| Paraguayans | 99.9 /100 | #53 | Exceptional $95,737 |
| Egyptians | 99.9 /100 | #54 | Exceptional $95,673 |
| Immigrants | Czechoslovakia | 99.9 /100 | #55 | Exceptional $95,319 |
Demographics Similar to Immigrants from Serbia by Median Household Income
In terms of median household income, the demographic groups most similar to Immigrants from Serbia are Jordanian ($91,794, a difference of 0.070%), Armenian ($91,807, a difference of 0.080%), Immigrants from North America ($91,860, a difference of 0.14%), Immigrants from Southern Europe ($91,605, a difference of 0.14%), and Immigrants from Lebanon ($91,887, a difference of 0.17%).
| Demographics | Rating | Rank | Median Household Income |
| Assyrians/Chaldeans/Syriacs | 98.8 /100 | #90 | Exceptional $91,991 |
| Immigrants | Vietnam | 98.8 /100 | #91 | Exceptional $91,987 |
| Immigrants | Western Europe | 98.8 /100 | #92 | Exceptional $91,936 |
| Immigrants | Lebanon | 98.7 /100 | #93 | Exceptional $91,887 |
| Immigrants | North America | 98.7 /100 | #94 | Exceptional $91,860 |
| Armenians | 98.7 /100 | #95 | Exceptional $91,807 |
| Jordanians | 98.7 /100 | #96 | Exceptional $91,794 |
| Immigrants | Serbia | 98.6 /100 | #97 | Exceptional $91,730 |
| Immigrants | Southern Europe | 98.5 /100 | #98 | Exceptional $91,605 |
| Immigrants | South Eastern Asia | 98.4 /100 | #99 | Exceptional $91,541 |
| Ukrainians | 98.3 /100 | #100 | Exceptional $91,456 |
| Immigrants | Moldova | 98.3 /100 | #101 | Exceptional $91,446 |
| Austrians | 98.2 /100 | #102 | Exceptional $91,339 |
| Immigrants | Ukraine | 98.0 /100 | #103 | Exceptional $91,124 |
| Immigrants | Kazakhstan | 97.8 /100 | #104 | Exceptional $91,015 |