Asian vs Immigrants from Northern Europe Median Household Income
COMPARE
Asian
Immigrants from Northern Europe
Median Household Income
Median Household Income Comparison
Asians
Immigrants from Northern Europe
$101,681
MEDIAN HOUSEHOLD INCOME
100.0/ 100
METRIC RATING
22nd/ 347
METRIC RANK
$99,813
MEDIAN HOUSEHOLD INCOME
100.0/ 100
METRIC RATING
30th/ 347
METRIC RANK
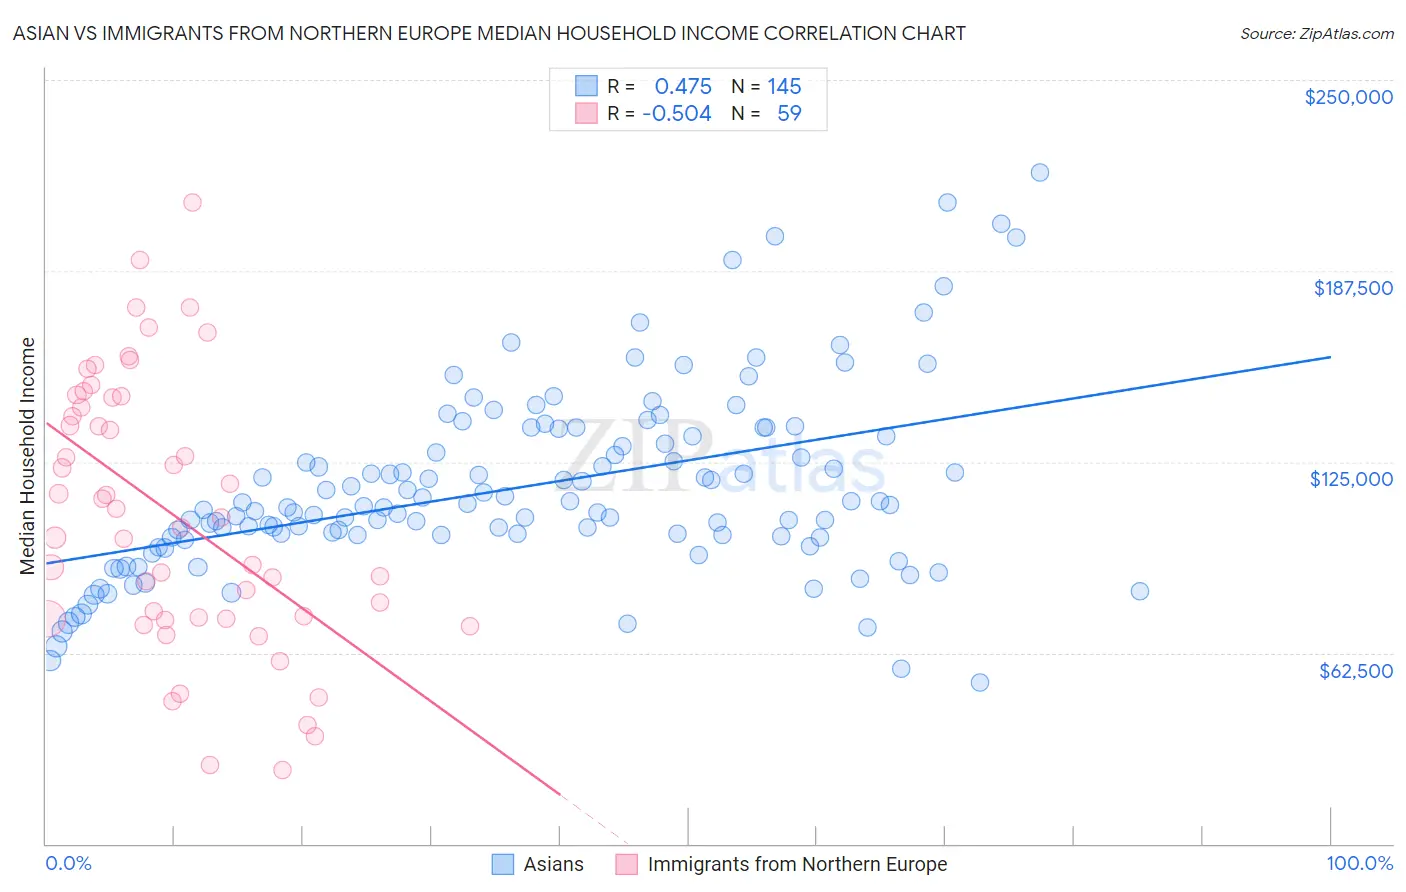
Asian vs Immigrants from Northern Europe Median Household Income Correlation Chart
The statistical analysis conducted on geographies consisting of 549,980,753 people shows a moderate positive correlation between the proportion of Asians and median household income in the United States with a correlation coefficient (R) of 0.475 and weighted average of $101,681. Similarly, the statistical analysis conducted on geographies consisting of 476,802,957 people shows a substantial negative correlation between the proportion of Immigrants from Northern Europe and median household income in the United States with a correlation coefficient (R) of -0.504 and weighted average of $99,813, a difference of 1.9%.
Median Household Income Correlation Summary
| Measurement | Asian | Immigrants from Northern Europe |
| Minimum | $52,658 | $24,028 |
| Maximum | $219,913 | $209,716 |
| Range | $167,255 | $185,688 |
| Mean | $116,419 | $107,993 |
| Median | $110,126 | $106,962 |
| Interquartile 25% (IQ1) | $100,433 | $73,842 |
| Interquartile 75% (IQ3) | $133,482 | $145,929 |
| Interquartile Range (IQR) | $33,049 | $72,086 |
| Standard Deviation (Sample) | $30,496 | $43,756 |
| Standard Deviation (Population) | $30,391 | $43,384 |
Demographics Similar to Asians and Immigrants from Northern Europe by Median Household Income
In terms of median household income, the demographic groups most similar to Asians are Eastern European ($101,781, a difference of 0.10%), Immigrants from Bolivia ($101,394, a difference of 0.28%), Bolivian ($102,195, a difference of 0.50%), Immigrants from Australia ($102,562, a difference of 0.87%), and Immigrants from Japan ($100,711, a difference of 0.96%). Similarly, the demographic groups most similar to Immigrants from Northern Europe are Immigrants from Asia ($99,933, a difference of 0.12%), Immigrants from Sri Lanka ($99,943, a difference of 0.13%), Bhutanese ($100,151, a difference of 0.34%), Turkish ($99,389, a difference of 0.43%), and Immigrants from Belgium ($100,306, a difference of 0.49%).
| Demographics | Rating | Rank | Median Household Income |
| Burmese | 100.0 /100 | #16 | Exceptional $103,145 |
| Immigrants | Korea | 100.0 /100 | #17 | Exceptional $102,962 |
| Cypriots | 100.0 /100 | #18 | Exceptional $102,843 |
| Immigrants | Australia | 100.0 /100 | #19 | Exceptional $102,562 |
| Bolivians | 100.0 /100 | #20 | Exceptional $102,195 |
| Eastern Europeans | 100.0 /100 | #21 | Exceptional $101,781 |
| Asians | 100.0 /100 | #22 | Exceptional $101,681 |
| Immigrants | Bolivia | 100.0 /100 | #23 | Exceptional $101,394 |
| Immigrants | Japan | 100.0 /100 | #24 | Exceptional $100,711 |
| Immigrants | Sweden | 100.0 /100 | #25 | Exceptional $100,699 |
| Immigrants | Belgium | 100.0 /100 | #26 | Exceptional $100,306 |
| Bhutanese | 100.0 /100 | #27 | Exceptional $100,151 |
| Immigrants | Sri Lanka | 100.0 /100 | #28 | Exceptional $99,943 |
| Immigrants | Asia | 100.0 /100 | #29 | Exceptional $99,933 |
| Immigrants | Northern Europe | 100.0 /100 | #30 | Exceptional $99,813 |
| Turks | 100.0 /100 | #31 | Exceptional $99,389 |
| Immigrants | Denmark | 100.0 /100 | #32 | Exceptional $98,510 |
| Chinese | 100.0 /100 | #33 | Exceptional $98,496 |
| Russians | 100.0 /100 | #34 | Exceptional $98,008 |
| Immigrants | Switzerland | 100.0 /100 | #35 | Exceptional $97,979 |
| Immigrants | Pakistan | 100.0 /100 | #36 | Exceptional $97,528 |