Asian vs Immigrants from Kuwait Median Household Income
COMPARE
Asian
Immigrants from Kuwait
Median Household Income
Median Household Income Comparison
Asians
Immigrants from Kuwait
$101,681
MEDIAN HOUSEHOLD INCOME
100.0/ 100
METRIC RATING
22nd/ 347
METRIC RANK
$89,263
MEDIAN HOUSEHOLD INCOME
93.5/ 100
METRIC RATING
125th/ 347
METRIC RANK
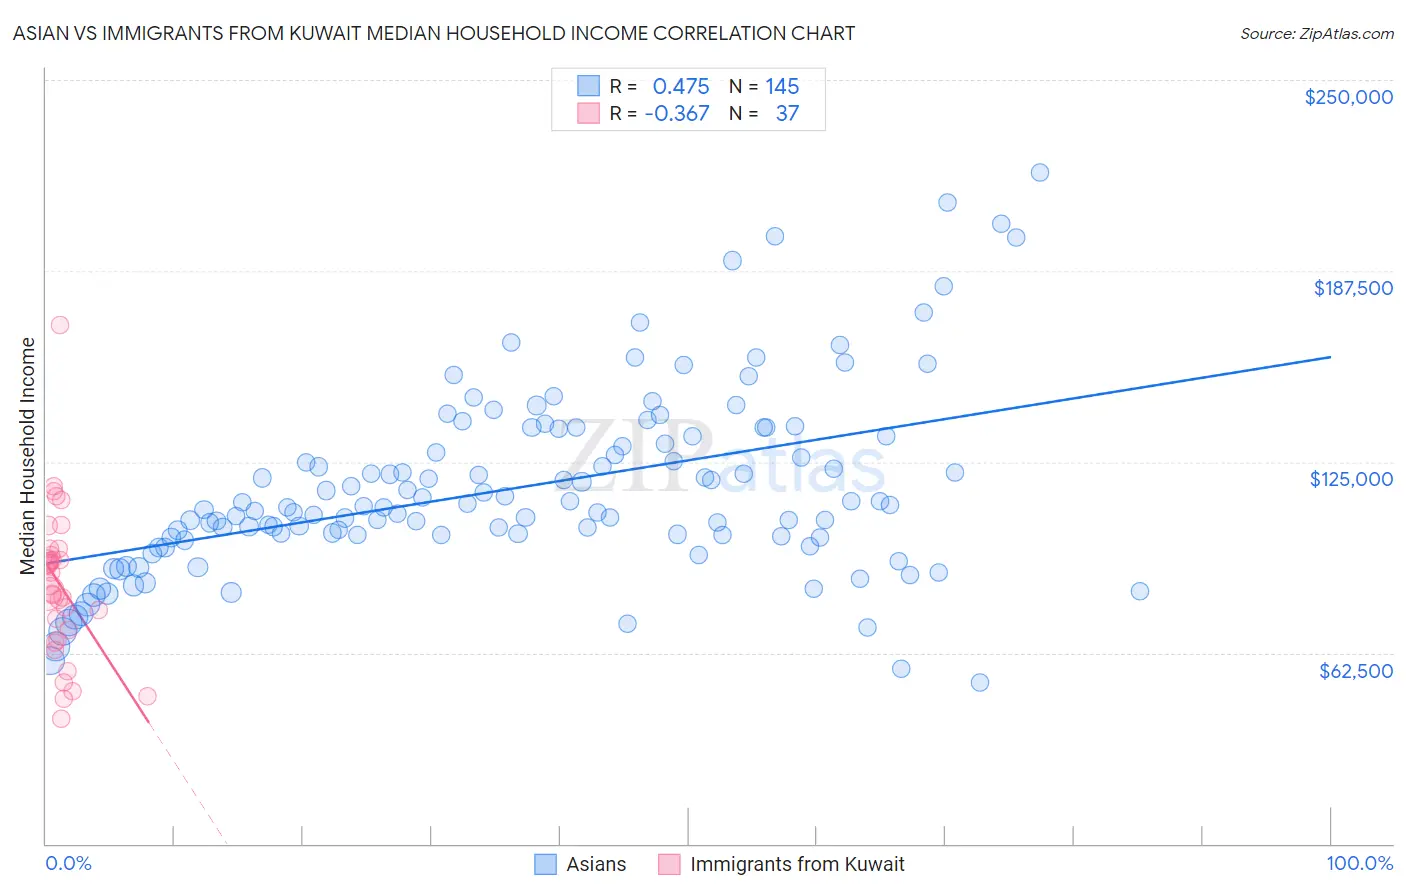
Asian vs Immigrants from Kuwait Median Household Income Correlation Chart
The statistical analysis conducted on geographies consisting of 549,980,753 people shows a moderate positive correlation between the proportion of Asians and median household income in the United States with a correlation coefficient (R) of 0.475 and weighted average of $101,681. Similarly, the statistical analysis conducted on geographies consisting of 136,867,834 people shows a mild negative correlation between the proportion of Immigrants from Kuwait and median household income in the United States with a correlation coefficient (R) of -0.367 and weighted average of $89,263, a difference of 13.9%.
Median Household Income Correlation Summary
| Measurement | Asian | Immigrants from Kuwait |
| Minimum | $52,658 | $41,103 |
| Maximum | $219,913 | $169,621 |
| Range | $167,255 | $128,518 |
| Mean | $116,419 | $84,844 |
| Median | $110,126 | $84,244 |
| Interquartile 25% (IQ1) | $100,433 | $68,396 |
| Interquartile 75% (IQ3) | $133,482 | $95,528 |
| Interquartile Range (IQR) | $33,049 | $27,132 |
| Standard Deviation (Sample) | $30,496 | $24,541 |
| Standard Deviation (Population) | $30,391 | $24,207 |
Similar Demographics by Median Household Income
Demographics Similar to Asians by Median Household Income
In terms of median household income, the demographic groups most similar to Asians are Eastern European ($101,781, a difference of 0.10%), Immigrants from Bolivia ($101,394, a difference of 0.28%), Bolivian ($102,195, a difference of 0.50%), Immigrants from Australia ($102,562, a difference of 0.87%), and Immigrants from Japan ($100,711, a difference of 0.96%).
| Demographics | Rating | Rank | Median Household Income |
| Immigrants | Israel | 100.0 /100 | #15 | Exceptional $104,090 |
| Burmese | 100.0 /100 | #16 | Exceptional $103,145 |
| Immigrants | Korea | 100.0 /100 | #17 | Exceptional $102,962 |
| Cypriots | 100.0 /100 | #18 | Exceptional $102,843 |
| Immigrants | Australia | 100.0 /100 | #19 | Exceptional $102,562 |
| Bolivians | 100.0 /100 | #20 | Exceptional $102,195 |
| Eastern Europeans | 100.0 /100 | #21 | Exceptional $101,781 |
| Asians | 100.0 /100 | #22 | Exceptional $101,681 |
| Immigrants | Bolivia | 100.0 /100 | #23 | Exceptional $101,394 |
| Immigrants | Japan | 100.0 /100 | #24 | Exceptional $100,711 |
| Immigrants | Sweden | 100.0 /100 | #25 | Exceptional $100,699 |
| Immigrants | Belgium | 100.0 /100 | #26 | Exceptional $100,306 |
| Bhutanese | 100.0 /100 | #27 | Exceptional $100,151 |
| Immigrants | Sri Lanka | 100.0 /100 | #28 | Exceptional $99,943 |
| Immigrants | Asia | 100.0 /100 | #29 | Exceptional $99,933 |
Demographics Similar to Immigrants from Kuwait by Median Household Income
In terms of median household income, the demographic groups most similar to Immigrants from Kuwait are Immigrants from Jordan ($89,412, a difference of 0.17%), Immigrants from Oceania ($89,100, a difference of 0.18%), Immigrants from Zimbabwe ($89,496, a difference of 0.26%), Immigrants from Peru ($89,010, a difference of 0.28%), and Portuguese ($88,976, a difference of 0.32%).
| Demographics | Rating | Rank | Median Household Income |
| Syrians | 95.4 /100 | #118 | Exceptional $89,830 |
| Albanians | 95.2 /100 | #119 | Exceptional $89,744 |
| Immigrants | North Macedonia | 95.2 /100 | #120 | Exceptional $89,741 |
| Ethiopians | 94.9 /100 | #121 | Exceptional $89,640 |
| Pakistanis | 94.8 /100 | #122 | Exceptional $89,638 |
| Immigrants | Zimbabwe | 94.4 /100 | #123 | Exceptional $89,496 |
| Immigrants | Jordan | 94.1 /100 | #124 | Exceptional $89,412 |
| Immigrants | Kuwait | 93.5 /100 | #125 | Exceptional $89,263 |
| Immigrants | Oceania | 92.9 /100 | #126 | Exceptional $89,100 |
| Immigrants | Peru | 92.5 /100 | #127 | Exceptional $89,010 |
| Portuguese | 92.3 /100 | #128 | Exceptional $88,976 |
| Brazilians | 92.1 /100 | #129 | Exceptional $88,934 |
| British | 92.0 /100 | #130 | Exceptional $88,914 |
| Immigrants | Syria | 91.4 /100 | #131 | Exceptional $88,792 |
| Europeans | 91.2 /100 | #132 | Exceptional $88,751 |