Asian vs Immigrants from Belarus Median Household Income
COMPARE
Asian
Immigrants from Belarus
Median Household Income
Median Household Income Comparison
Asians
Immigrants from Belarus
$101,681
MEDIAN HOUSEHOLD INCOME
100.0/ 100
METRIC RATING
22nd/ 347
METRIC RANK
$94,399
MEDIAN HOUSEHOLD INCOME
99.7/ 100
METRIC RATING
65th/ 347
METRIC RANK
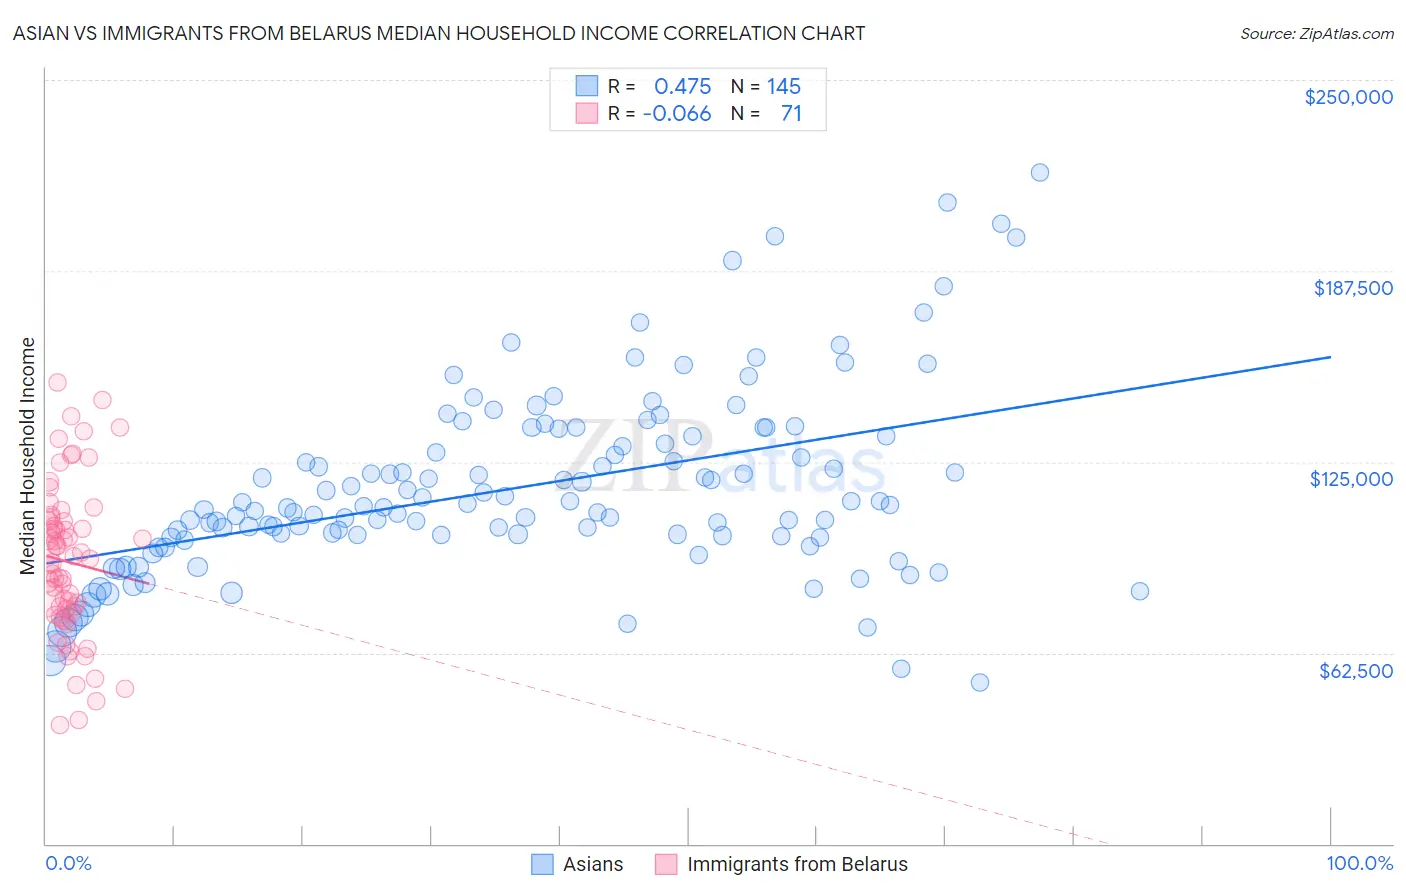
Asian vs Immigrants from Belarus Median Household Income Correlation Chart
The statistical analysis conducted on geographies consisting of 549,980,753 people shows a moderate positive correlation between the proportion of Asians and median household income in the United States with a correlation coefficient (R) of 0.475 and weighted average of $101,681. Similarly, the statistical analysis conducted on geographies consisting of 150,184,095 people shows a slight negative correlation between the proportion of Immigrants from Belarus and median household income in the United States with a correlation coefficient (R) of -0.066 and weighted average of $94,399, a difference of 7.7%.
Median Household Income Correlation Summary
| Measurement | Asian | Immigrants from Belarus |
| Minimum | $52,658 | $38,670 |
| Maximum | $219,913 | $150,801 |
| Range | $167,255 | $112,131 |
| Mean | $116,419 | $92,306 |
| Median | $110,126 | $93,264 |
| Interquartile 25% (IQ1) | $100,433 | $75,784 |
| Interquartile 75% (IQ3) | $133,482 | $105,707 |
| Interquartile Range (IQR) | $33,049 | $29,923 |
| Standard Deviation (Sample) | $30,496 | $25,053 |
| Standard Deviation (Population) | $30,391 | $24,876 |
Similar Demographics by Median Household Income
Demographics Similar to Asians by Median Household Income
In terms of median household income, the demographic groups most similar to Asians are Eastern European ($101,781, a difference of 0.10%), Immigrants from Bolivia ($101,394, a difference of 0.28%), Bolivian ($102,195, a difference of 0.50%), Immigrants from Australia ($102,562, a difference of 0.87%), and Immigrants from Japan ($100,711, a difference of 0.96%).
| Demographics | Rating | Rank | Median Household Income |
| Immigrants | Israel | 100.0 /100 | #15 | Exceptional $104,090 |
| Burmese | 100.0 /100 | #16 | Exceptional $103,145 |
| Immigrants | Korea | 100.0 /100 | #17 | Exceptional $102,962 |
| Cypriots | 100.0 /100 | #18 | Exceptional $102,843 |
| Immigrants | Australia | 100.0 /100 | #19 | Exceptional $102,562 |
| Bolivians | 100.0 /100 | #20 | Exceptional $102,195 |
| Eastern Europeans | 100.0 /100 | #21 | Exceptional $101,781 |
| Asians | 100.0 /100 | #22 | Exceptional $101,681 |
| Immigrants | Bolivia | 100.0 /100 | #23 | Exceptional $101,394 |
| Immigrants | Japan | 100.0 /100 | #24 | Exceptional $100,711 |
| Immigrants | Sweden | 100.0 /100 | #25 | Exceptional $100,699 |
| Immigrants | Belgium | 100.0 /100 | #26 | Exceptional $100,306 |
| Bhutanese | 100.0 /100 | #27 | Exceptional $100,151 |
| Immigrants | Sri Lanka | 100.0 /100 | #28 | Exceptional $99,943 |
| Immigrants | Asia | 100.0 /100 | #29 | Exceptional $99,933 |
Demographics Similar to Immigrants from Belarus by Median Household Income
In terms of median household income, the demographic groups most similar to Immigrants from Belarus are Immigrants from Netherlands ($94,411, a difference of 0.010%), Immigrants from Romania ($94,222, a difference of 0.19%), Immigrants from Scotland ($94,091, a difference of 0.33%), Greek ($94,735, a difference of 0.36%), and Mongolian ($93,971, a difference of 0.46%).
| Demographics | Rating | Rank | Median Household Income |
| Soviet Union | 99.8 /100 | #58 | Exceptional $95,098 |
| Immigrants | Europe | 99.8 /100 | #59 | Exceptional $95,032 |
| Koreans | 99.8 /100 | #60 | Exceptional $95,018 |
| Laotians | 99.8 /100 | #61 | Exceptional $94,990 |
| Immigrants | Norway | 99.8 /100 | #62 | Exceptional $94,846 |
| Greeks | 99.8 /100 | #63 | Exceptional $94,735 |
| Immigrants | Netherlands | 99.7 /100 | #64 | Exceptional $94,411 |
| Immigrants | Belarus | 99.7 /100 | #65 | Exceptional $94,399 |
| Immigrants | Romania | 99.7 /100 | #66 | Exceptional $94,222 |
| Immigrants | Scotland | 99.7 /100 | #67 | Exceptional $94,091 |
| Mongolians | 99.7 /100 | #68 | Exceptional $93,971 |
| Argentineans | 99.7 /100 | #69 | Exceptional $93,960 |
| Immigrants | Fiji | 99.7 /100 | #70 | Exceptional $93,933 |
| Immigrants | Philippines | 99.6 /100 | #71 | Exceptional $93,899 |
| Lithuanians | 99.6 /100 | #72 | Exceptional $93,852 |