Moroccan vs Immigrants from Serbia Median Household Income
COMPARE
Moroccan
Immigrants from Serbia
Median Household Income
Median Household Income Comparison
Moroccans
Immigrants from Serbia
$86,468
MEDIAN HOUSEHOLD INCOME
70.6/ 100
METRIC RATING
158th/ 347
METRIC RANK
$91,730
MEDIAN HOUSEHOLD INCOME
98.6/ 100
METRIC RATING
97th/ 347
METRIC RANK
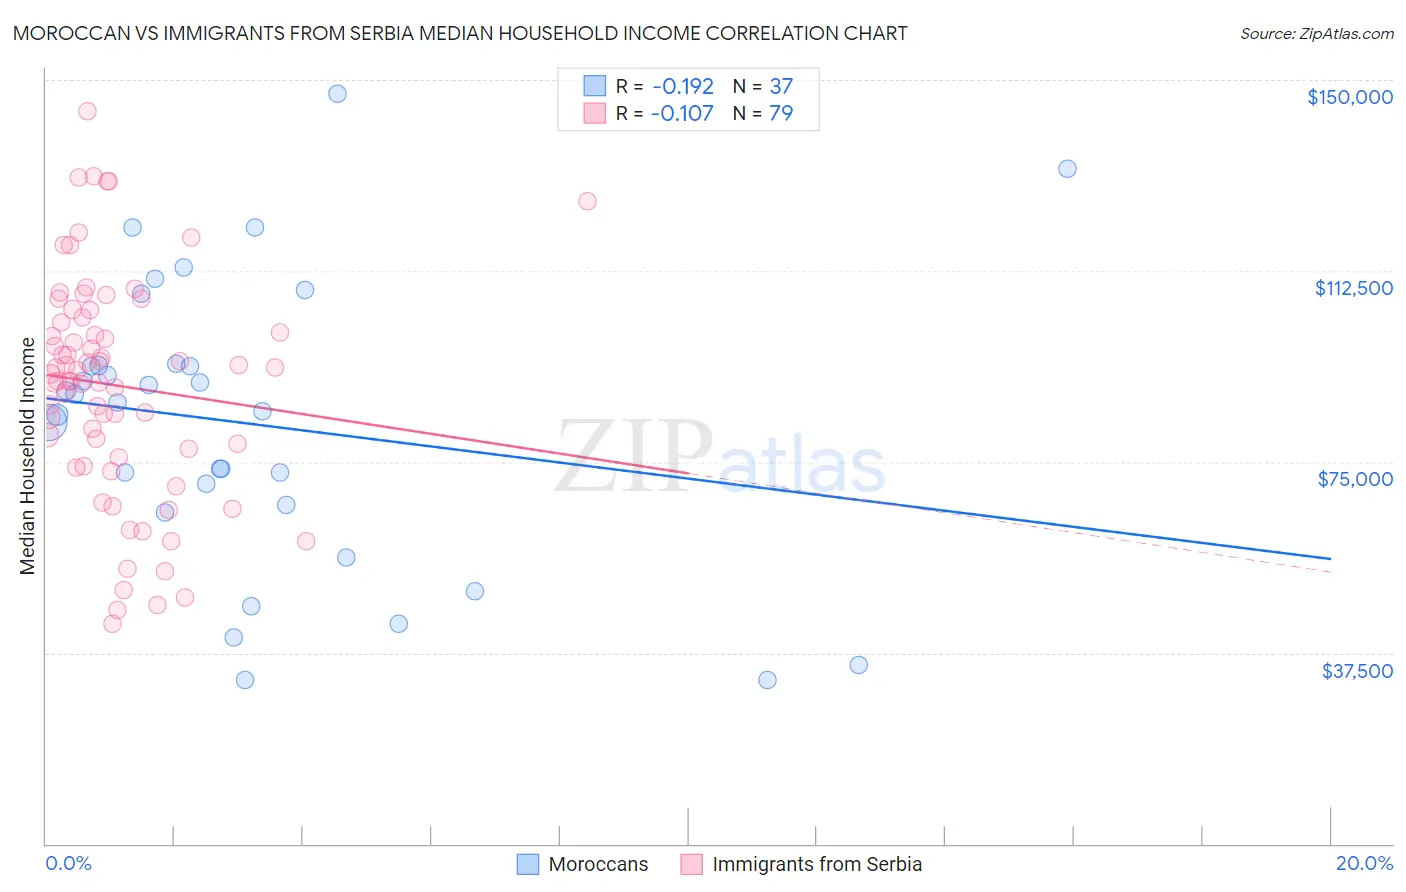
Moroccan vs Immigrants from Serbia Median Household Income Correlation Chart
The statistical analysis conducted on geographies consisting of 201,723,300 people shows a poor negative correlation between the proportion of Moroccans and median household income in the United States with a correlation coefficient (R) of -0.192 and weighted average of $86,468. Similarly, the statistical analysis conducted on geographies consisting of 131,713,671 people shows a poor negative correlation between the proportion of Immigrants from Serbia and median household income in the United States with a correlation coefficient (R) of -0.107 and weighted average of $91,730, a difference of 6.1%.
Median Household Income Correlation Summary
| Measurement | Moroccan | Immigrants from Serbia |
| Minimum | $32,040 | $43,214 |
| Maximum | $147,408 | $143,885 |
| Range | $115,368 | $100,671 |
| Mean | $82,404 | $89,961 |
| Median | $86,580 | $92,273 |
| Interquartile 25% (IQ1) | $65,781 | $75,804 |
| Interquartile 75% (IQ3) | $94,096 | $103,357 |
| Interquartile Range (IQR) | $28,314 | $27,553 |
| Standard Deviation (Sample) | $28,098 | $22,012 |
| Standard Deviation (Population) | $27,716 | $21,872 |
Similar Demographics by Median Household Income
Demographics Similar to Moroccans by Median Household Income
In terms of median household income, the demographic groups most similar to Moroccans are Samoan ($86,498, a difference of 0.040%), Immigrants from Uzbekistan ($86,425, a difference of 0.050%), Luxembourger ($86,418, a difference of 0.060%), Immigrants from Albania ($86,534, a difference of 0.080%), and Slavic ($86,398, a difference of 0.080%).
| Demographics | Rating | Rank | Median Household Income |
| Hungarians | 76.3 /100 | #151 | Good $86,920 |
| Immigrants | Saudi Arabia | 75.8 /100 | #152 | Good $86,875 |
| South Americans | 75.1 /100 | #153 | Good $86,824 |
| Immigrants | Germany | 74.4 /100 | #154 | Good $86,764 |
| Carpatho Rusyns | 72.8 /100 | #155 | Good $86,635 |
| Immigrants | Albania | 71.5 /100 | #156 | Good $86,534 |
| Samoans | 71.0 /100 | #157 | Good $86,498 |
| Moroccans | 70.6 /100 | #158 | Good $86,468 |
| Immigrants | Uzbekistan | 70.1 /100 | #159 | Good $86,425 |
| Luxembourgers | 70.0 /100 | #160 | Good $86,418 |
| Slavs | 69.7 /100 | #161 | Good $86,398 |
| Guamanians/Chamorros | 67.7 /100 | #162 | Good $86,255 |
| Czechs | 66.4 /100 | #163 | Good $86,164 |
| Irish | 66.2 /100 | #164 | Good $86,145 |
| Norwegians | 65.3 /100 | #165 | Good $86,084 |
Demographics Similar to Immigrants from Serbia by Median Household Income
In terms of median household income, the demographic groups most similar to Immigrants from Serbia are Jordanian ($91,794, a difference of 0.070%), Armenian ($91,807, a difference of 0.080%), Immigrants from North America ($91,860, a difference of 0.14%), Immigrants from Southern Europe ($91,605, a difference of 0.14%), and Immigrants from Lebanon ($91,887, a difference of 0.17%).
| Demographics | Rating | Rank | Median Household Income |
| Assyrians/Chaldeans/Syriacs | 98.8 /100 | #90 | Exceptional $91,991 |
| Immigrants | Vietnam | 98.8 /100 | #91 | Exceptional $91,987 |
| Immigrants | Western Europe | 98.8 /100 | #92 | Exceptional $91,936 |
| Immigrants | Lebanon | 98.7 /100 | #93 | Exceptional $91,887 |
| Immigrants | North America | 98.7 /100 | #94 | Exceptional $91,860 |
| Armenians | 98.7 /100 | #95 | Exceptional $91,807 |
| Jordanians | 98.7 /100 | #96 | Exceptional $91,794 |
| Immigrants | Serbia | 98.6 /100 | #97 | Exceptional $91,730 |
| Immigrants | Southern Europe | 98.5 /100 | #98 | Exceptional $91,605 |
| Immigrants | South Eastern Asia | 98.4 /100 | #99 | Exceptional $91,541 |
| Ukrainians | 98.3 /100 | #100 | Exceptional $91,456 |
| Immigrants | Moldova | 98.3 /100 | #101 | Exceptional $91,446 |
| Austrians | 98.2 /100 | #102 | Exceptional $91,339 |
| Immigrants | Ukraine | 98.0 /100 | #103 | Exceptional $91,124 |
| Immigrants | Kazakhstan | 97.8 /100 | #104 | Exceptional $91,015 |