Navajo vs Immigrants from Serbia Median Household Income
COMPARE
Navajo
Immigrants from Serbia
Median Household Income
Median Household Income Comparison
Navajo
Immigrants from Serbia
$59,159
MEDIAN HOUSEHOLD INCOME
0.0/ 100
METRIC RATING
346th/ 347
METRIC RANK
$91,730
MEDIAN HOUSEHOLD INCOME
98.6/ 100
METRIC RATING
97th/ 347
METRIC RANK
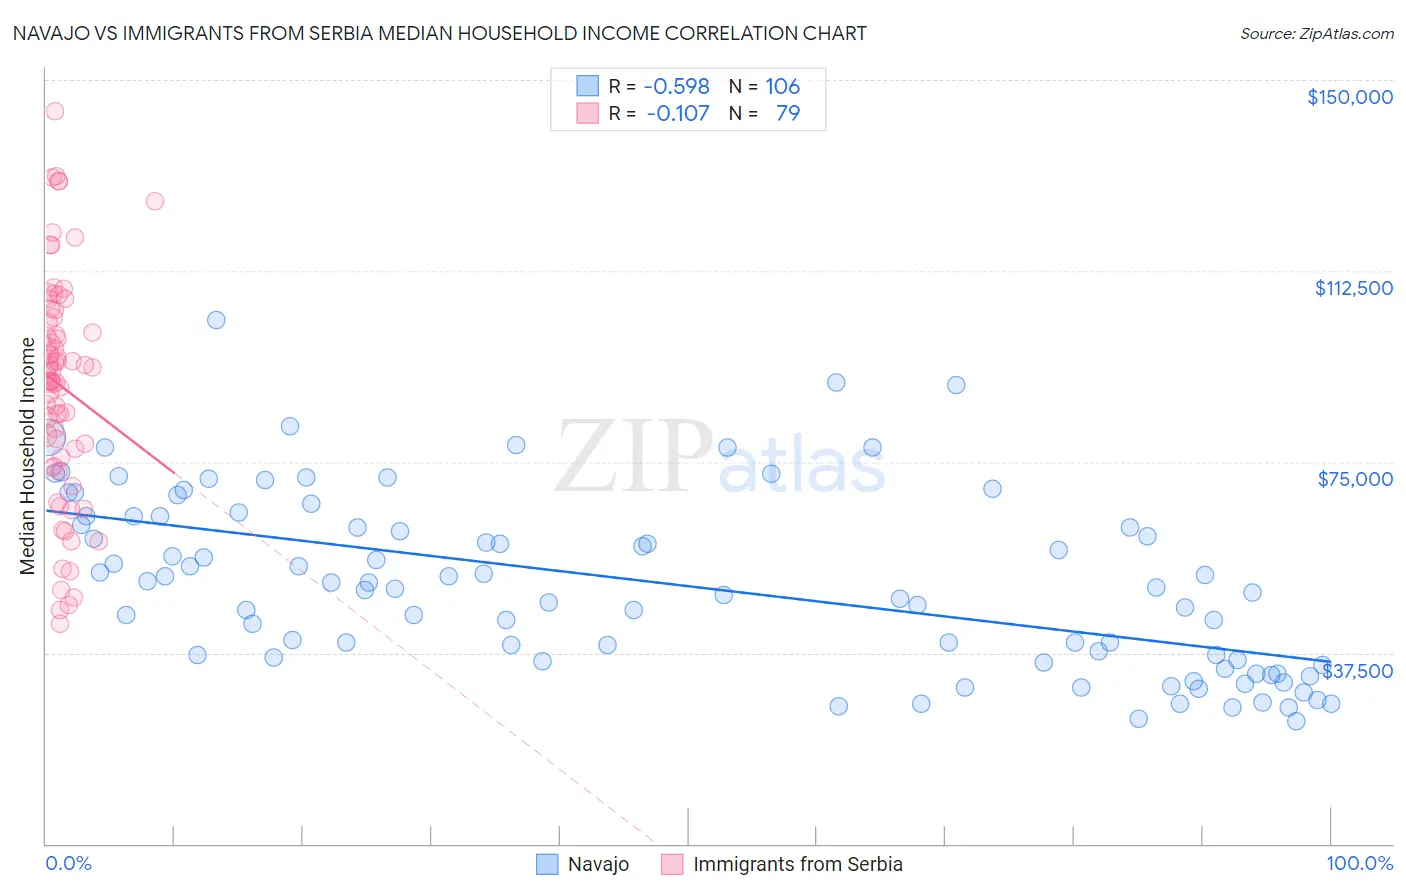
Navajo vs Immigrants from Serbia Median Household Income Correlation Chart
The statistical analysis conducted on geographies consisting of 224,715,573 people shows a substantial negative correlation between the proportion of Navajo and median household income in the United States with a correlation coefficient (R) of -0.598 and weighted average of $59,159. Similarly, the statistical analysis conducted on geographies consisting of 131,713,671 people shows a poor negative correlation between the proportion of Immigrants from Serbia and median household income in the United States with a correlation coefficient (R) of -0.107 and weighted average of $91,730, a difference of 55.1%.
Median Household Income Correlation Summary
| Measurement | Navajo | Immigrants from Serbia |
| Minimum | $24,004 | $43,214 |
| Maximum | $102,885 | $143,885 |
| Range | $78,881 | $100,671 |
| Mean | $51,106 | $89,961 |
| Median | $50,167 | $92,273 |
| Interquartile 25% (IQ1) | $36,185 | $75,804 |
| Interquartile 75% (IQ3) | $64,286 | $103,357 |
| Interquartile Range (IQR) | $28,101 | $27,553 |
| Standard Deviation (Sample) | $17,310 | $22,012 |
| Standard Deviation (Population) | $17,228 | $21,872 |
Similar Demographics by Median Household Income
Demographics Similar to Navajo by Median Household Income
In terms of median household income, the demographic groups most similar to Navajo are Puerto Rican ($59,197, a difference of 0.060%), Tohono O'odham ($61,663, a difference of 4.2%), Houma ($62,575, a difference of 5.8%), Pima ($63,262, a difference of 6.9%), and Crow ($63,681, a difference of 7.6%).
| Demographics | Rating | Rank | Median Household Income |
| Creek | 0.0 /100 | #333 | Tragic $67,715 |
| Blacks/African Americans | 0.0 /100 | #334 | Tragic $67,573 |
| Cheyenne | 0.0 /100 | #335 | Tragic $66,974 |
| Immigrants | Congo | 0.0 /100 | #336 | Tragic $66,768 |
| Kiowa | 0.0 /100 | #337 | Tragic $65,914 |
| Immigrants | Yemen | 0.0 /100 | #338 | Tragic $65,194 |
| Hopi | 0.0 /100 | #339 | Tragic $65,043 |
| Pueblo | 0.0 /100 | #340 | Tragic $64,692 |
| Crow | 0.0 /100 | #341 | Tragic $63,681 |
| Pima | 0.0 /100 | #342 | Tragic $63,262 |
| Houma | 0.0 /100 | #343 | Tragic $62,575 |
| Tohono O'odham | 0.0 /100 | #344 | Tragic $61,663 |
| Puerto Ricans | 0.0 /100 | #345 | Tragic $59,197 |
| Navajo | 0.0 /100 | #346 | Tragic $59,159 |
| Lumbee | 0.0 /100 | #347 | Tragic $54,644 |
Demographics Similar to Immigrants from Serbia by Median Household Income
In terms of median household income, the demographic groups most similar to Immigrants from Serbia are Jordanian ($91,794, a difference of 0.070%), Armenian ($91,807, a difference of 0.080%), Immigrants from North America ($91,860, a difference of 0.14%), Immigrants from Southern Europe ($91,605, a difference of 0.14%), and Immigrants from Lebanon ($91,887, a difference of 0.17%).
| Demographics | Rating | Rank | Median Household Income |
| Assyrians/Chaldeans/Syriacs | 98.8 /100 | #90 | Exceptional $91,991 |
| Immigrants | Vietnam | 98.8 /100 | #91 | Exceptional $91,987 |
| Immigrants | Western Europe | 98.8 /100 | #92 | Exceptional $91,936 |
| Immigrants | Lebanon | 98.7 /100 | #93 | Exceptional $91,887 |
| Immigrants | North America | 98.7 /100 | #94 | Exceptional $91,860 |
| Armenians | 98.7 /100 | #95 | Exceptional $91,807 |
| Jordanians | 98.7 /100 | #96 | Exceptional $91,794 |
| Immigrants | Serbia | 98.6 /100 | #97 | Exceptional $91,730 |
| Immigrants | Southern Europe | 98.5 /100 | #98 | Exceptional $91,605 |
| Immigrants | South Eastern Asia | 98.4 /100 | #99 | Exceptional $91,541 |
| Ukrainians | 98.3 /100 | #100 | Exceptional $91,456 |
| Immigrants | Moldova | 98.3 /100 | #101 | Exceptional $91,446 |
| Austrians | 98.2 /100 | #102 | Exceptional $91,339 |
| Immigrants | Ukraine | 98.0 /100 | #103 | Exceptional $91,124 |
| Immigrants | Kazakhstan | 97.8 /100 | #104 | Exceptional $91,015 |