Asian vs Alaska Native Median Household Income
COMPARE
Asian
Alaska Native
Median Household Income
Median Household Income Comparison
Asians
Alaska Natives
$101,681
MEDIAN HOUSEHOLD INCOME
100.0/ 100
METRIC RATING
22nd/ 347
METRIC RANK
$79,509
MEDIAN HOUSEHOLD INCOME
2.7/ 100
METRIC RATING
239th/ 347
METRIC RANK
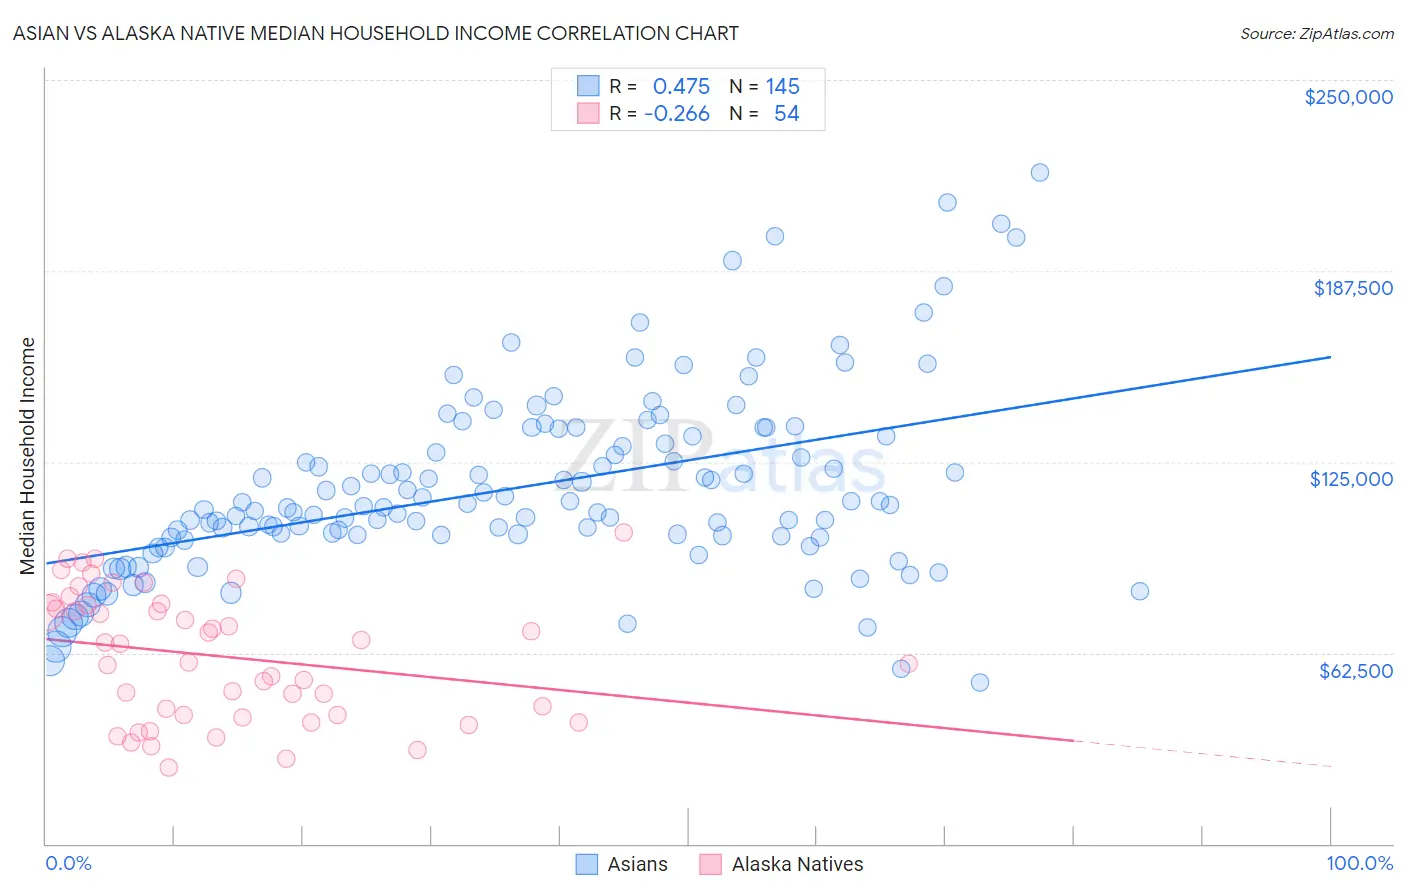
Asian vs Alaska Native Median Household Income Correlation Chart
The statistical analysis conducted on geographies consisting of 549,980,753 people shows a moderate positive correlation between the proportion of Asians and median household income in the United States with a correlation coefficient (R) of 0.475 and weighted average of $101,681. Similarly, the statistical analysis conducted on geographies consisting of 76,748,502 people shows a weak negative correlation between the proportion of Alaska Natives and median household income in the United States with a correlation coefficient (R) of -0.266 and weighted average of $79,509, a difference of 27.9%.
Median Household Income Correlation Summary
| Measurement | Asian | Alaska Native |
| Minimum | $52,658 | $25,000 |
| Maximum | $219,913 | $102,083 |
| Range | $167,255 | $77,083 |
| Mean | $116,419 | $61,313 |
| Median | $110,126 | $62,466 |
| Interquartile 25% (IQ1) | $100,433 | $41,964 |
| Interquartile 75% (IQ3) | $133,482 | $78,336 |
| Interquartile Range (IQR) | $33,049 | $36,372 |
| Standard Deviation (Sample) | $30,496 | $20,803 |
| Standard Deviation (Population) | $30,391 | $20,609 |
Similar Demographics by Median Household Income
Demographics Similar to Asians by Median Household Income
In terms of median household income, the demographic groups most similar to Asians are Eastern European ($101,781, a difference of 0.10%), Immigrants from Bolivia ($101,394, a difference of 0.28%), Bolivian ($102,195, a difference of 0.50%), Immigrants from Australia ($102,562, a difference of 0.87%), and Immigrants from Japan ($100,711, a difference of 0.96%).
| Demographics | Rating | Rank | Median Household Income |
| Immigrants | Israel | 100.0 /100 | #15 | Exceptional $104,090 |
| Burmese | 100.0 /100 | #16 | Exceptional $103,145 |
| Immigrants | Korea | 100.0 /100 | #17 | Exceptional $102,962 |
| Cypriots | 100.0 /100 | #18 | Exceptional $102,843 |
| Immigrants | Australia | 100.0 /100 | #19 | Exceptional $102,562 |
| Bolivians | 100.0 /100 | #20 | Exceptional $102,195 |
| Eastern Europeans | 100.0 /100 | #21 | Exceptional $101,781 |
| Asians | 100.0 /100 | #22 | Exceptional $101,681 |
| Immigrants | Bolivia | 100.0 /100 | #23 | Exceptional $101,394 |
| Immigrants | Japan | 100.0 /100 | #24 | Exceptional $100,711 |
| Immigrants | Sweden | 100.0 /100 | #25 | Exceptional $100,699 |
| Immigrants | Belgium | 100.0 /100 | #26 | Exceptional $100,306 |
| Bhutanese | 100.0 /100 | #27 | Exceptional $100,151 |
| Immigrants | Sri Lanka | 100.0 /100 | #28 | Exceptional $99,943 |
| Immigrants | Asia | 100.0 /100 | #29 | Exceptional $99,933 |
Demographics Similar to Alaska Natives by Median Household Income
In terms of median household income, the demographic groups most similar to Alaska Natives are Immigrants from Western Africa ($79,490, a difference of 0.020%), Nonimmigrants ($79,429, a difference of 0.10%), Barbadian ($79,664, a difference of 0.20%), Nicaraguan ($79,737, a difference of 0.29%), and Immigrants from Bosnia and Herzegovina ($79,888, a difference of 0.48%).
| Demographics | Rating | Rank | Median Household Income |
| Immigrants | Trinidad and Tobago | 4.6 /100 | #232 | Tragic $80,373 |
| Immigrants | Azores | 4.5 /100 | #233 | Tragic $80,357 |
| Immigrants | Ecuador | 4.5 /100 | #234 | Tragic $80,341 |
| Immigrants | Guyana | 4.5 /100 | #235 | Tragic $80,324 |
| Immigrants | Bosnia and Herzegovina | 3.4 /100 | #236 | Tragic $79,888 |
| Nicaraguans | 3.1 /100 | #237 | Tragic $79,737 |
| Barbadians | 3.0 /100 | #238 | Tragic $79,664 |
| Alaska Natives | 2.7 /100 | #239 | Tragic $79,509 |
| Immigrants | Western Africa | 2.7 /100 | #240 | Tragic $79,490 |
| Immigrants | Nonimmigrants | 2.6 /100 | #241 | Tragic $79,429 |
| Immigrants | Sudan | 2.1 /100 | #242 | Tragic $79,103 |
| Immigrants | Barbados | 1.9 /100 | #243 | Tragic $78,989 |
| Marshallese | 1.9 /100 | #244 | Tragic $78,930 |
| Inupiat | 1.8 /100 | #245 | Tragic $78,841 |
| Central Americans | 1.7 /100 | #246 | Tragic $78,803 |