Asian vs Immigrants from Saudi Arabia Median Household Income
COMPARE
Asian
Immigrants from Saudi Arabia
Median Household Income
Median Household Income Comparison
Asians
Immigrants from Saudi Arabia
$101,681
MEDIAN HOUSEHOLD INCOME
100.0/ 100
METRIC RATING
22nd/ 347
METRIC RANK
$86,875
MEDIAN HOUSEHOLD INCOME
75.8/ 100
METRIC RATING
152nd/ 347
METRIC RANK
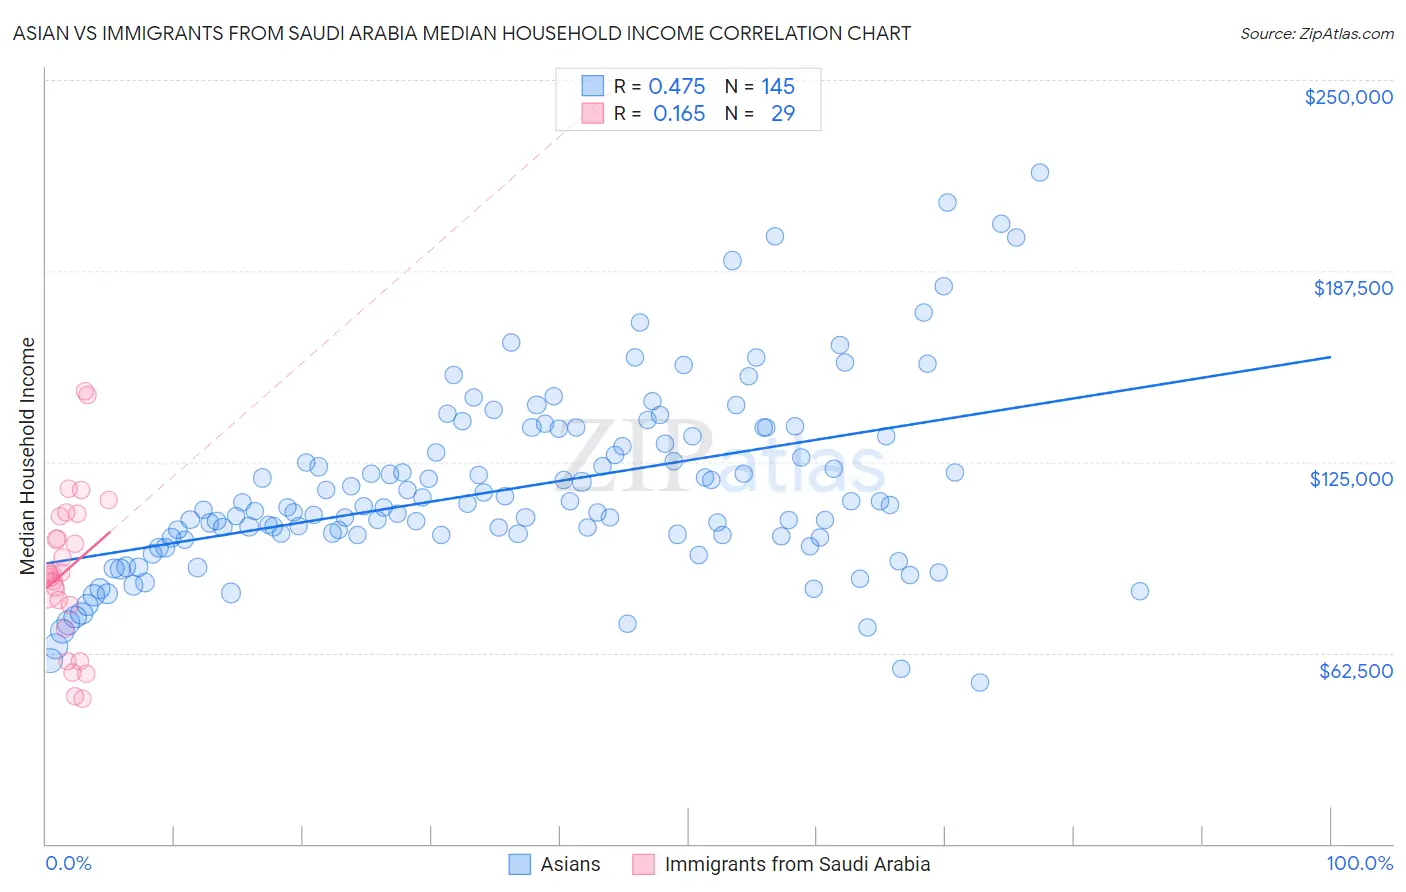
Asian vs Immigrants from Saudi Arabia Median Household Income Correlation Chart
The statistical analysis conducted on geographies consisting of 549,980,753 people shows a moderate positive correlation between the proportion of Asians and median household income in the United States with a correlation coefficient (R) of 0.475 and weighted average of $101,681. Similarly, the statistical analysis conducted on geographies consisting of 164,184,047 people shows a poor positive correlation between the proportion of Immigrants from Saudi Arabia and median household income in the United States with a correlation coefficient (R) of 0.165 and weighted average of $86,875, a difference of 17.0%.
Median Household Income Correlation Summary
| Measurement | Asian | Immigrants from Saudi Arabia |
| Minimum | $52,658 | $47,501 |
| Maximum | $219,913 | $148,227 |
| Range | $167,255 | $100,726 |
| Mean | $116,419 | $89,831 |
| Median | $110,126 | $88,579 |
| Interquartile 25% (IQ1) | $100,433 | $74,250 |
| Interquartile 75% (IQ3) | $133,482 | $107,595 |
| Interquartile Range (IQR) | $33,049 | $33,345 |
| Standard Deviation (Sample) | $30,496 | $25,493 |
| Standard Deviation (Population) | $30,391 | $25,050 |
Similar Demographics by Median Household Income
Demographics Similar to Asians by Median Household Income
In terms of median household income, the demographic groups most similar to Asians are Eastern European ($101,781, a difference of 0.10%), Immigrants from Bolivia ($101,394, a difference of 0.28%), Bolivian ($102,195, a difference of 0.50%), Immigrants from Australia ($102,562, a difference of 0.87%), and Immigrants from Japan ($100,711, a difference of 0.96%).
| Demographics | Rating | Rank | Median Household Income |
| Immigrants | Israel | 100.0 /100 | #15 | Exceptional $104,090 |
| Burmese | 100.0 /100 | #16 | Exceptional $103,145 |
| Immigrants | Korea | 100.0 /100 | #17 | Exceptional $102,962 |
| Cypriots | 100.0 /100 | #18 | Exceptional $102,843 |
| Immigrants | Australia | 100.0 /100 | #19 | Exceptional $102,562 |
| Bolivians | 100.0 /100 | #20 | Exceptional $102,195 |
| Eastern Europeans | 100.0 /100 | #21 | Exceptional $101,781 |
| Asians | 100.0 /100 | #22 | Exceptional $101,681 |
| Immigrants | Bolivia | 100.0 /100 | #23 | Exceptional $101,394 |
| Immigrants | Japan | 100.0 /100 | #24 | Exceptional $100,711 |
| Immigrants | Sweden | 100.0 /100 | #25 | Exceptional $100,699 |
| Immigrants | Belgium | 100.0 /100 | #26 | Exceptional $100,306 |
| Bhutanese | 100.0 /100 | #27 | Exceptional $100,151 |
| Immigrants | Sri Lanka | 100.0 /100 | #28 | Exceptional $99,943 |
| Immigrants | Asia | 100.0 /100 | #29 | Exceptional $99,933 |
Demographics Similar to Immigrants from Saudi Arabia by Median Household Income
In terms of median household income, the demographic groups most similar to Immigrants from Saudi Arabia are Hungarian ($86,920, a difference of 0.050%), South American ($86,824, a difference of 0.060%), Immigrants from Germany ($86,764, a difference of 0.13%), Basque ($87,001, a difference of 0.15%), and Immigrants from Nepal ($87,046, a difference of 0.20%).
| Demographics | Rating | Rank | Median Household Income |
| Ugandans | 82.9 /100 | #145 | Excellent $87,557 |
| Immigrants | Uganda | 82.8 /100 | #146 | Excellent $87,553 |
| South American Indians | 81.8 /100 | #147 | Excellent $87,446 |
| Costa Ricans | 80.0 /100 | #148 | Excellent $87,262 |
| Immigrants | Nepal | 77.7 /100 | #149 | Good $87,046 |
| Basques | 77.2 /100 | #150 | Good $87,001 |
| Hungarians | 76.3 /100 | #151 | Good $86,920 |
| Immigrants | Saudi Arabia | 75.8 /100 | #152 | Good $86,875 |
| South Americans | 75.1 /100 | #153 | Good $86,824 |
| Immigrants | Germany | 74.4 /100 | #154 | Good $86,764 |
| Carpatho Rusyns | 72.8 /100 | #155 | Good $86,635 |
| Immigrants | Albania | 71.5 /100 | #156 | Good $86,534 |
| Samoans | 71.0 /100 | #157 | Good $86,498 |
| Moroccans | 70.6 /100 | #158 | Good $86,468 |
| Immigrants | Uzbekistan | 70.1 /100 | #159 | Good $86,425 |