Asian vs Mexican American Indian Median Household Income
COMPARE
Asian
Mexican American Indian
Median Household Income
Median Household Income Comparison
Asians
Mexican American Indians
$101,681
MEDIAN HOUSEHOLD INCOME
100.0/ 100
METRIC RATING
22nd/ 347
METRIC RANK
$78,166
MEDIAN HOUSEHOLD INCOME
1.2/ 100
METRIC RATING
251st/ 347
METRIC RANK
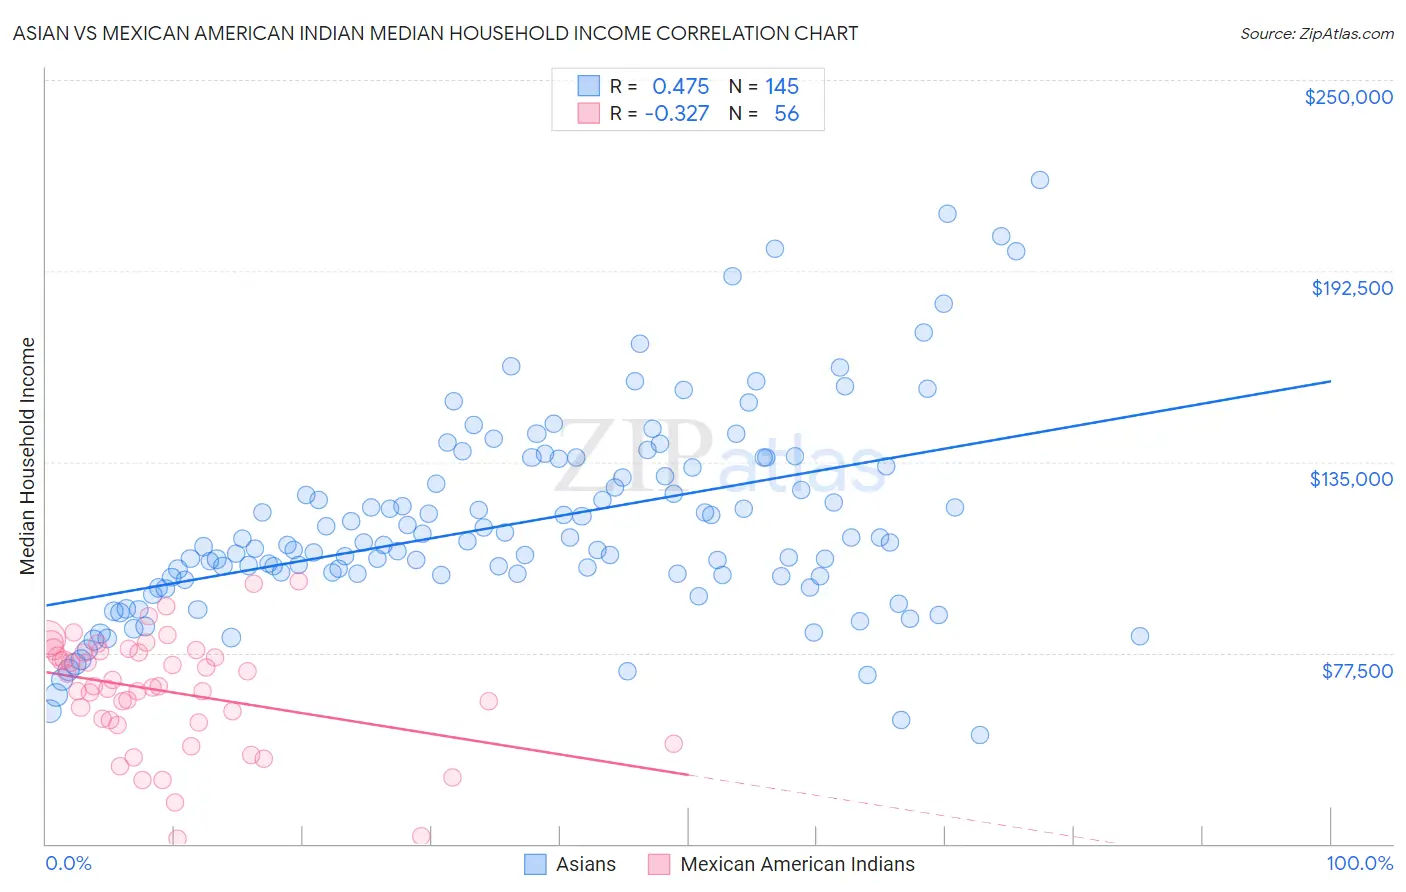
Asian vs Mexican American Indian Median Household Income Correlation Chart
The statistical analysis conducted on geographies consisting of 549,980,753 people shows a moderate positive correlation between the proportion of Asians and median household income in the United States with a correlation coefficient (R) of 0.475 and weighted average of $101,681. Similarly, the statistical analysis conducted on geographies consisting of 317,474,541 people shows a mild negative correlation between the proportion of Mexican American Indians and median household income in the United States with a correlation coefficient (R) of -0.327 and weighted average of $78,166, a difference of 30.1%.
Median Household Income Correlation Summary
| Measurement | Asian | Mexican American Indian |
| Minimum | $52,658 | $21,567 |
| Maximum | $219,913 | $98,902 |
| Range | $167,255 | $77,335 |
| Mean | $116,419 | $65,927 |
| Median | $110,126 | $67,552 |
| Interquartile 25% (IQ1) | $100,433 | $56,868 |
| Interquartile 75% (IQ3) | $133,482 | $77,810 |
| Interquartile Range (IQR) | $33,049 | $20,942 |
| Standard Deviation (Sample) | $30,496 | $17,155 |
| Standard Deviation (Population) | $30,391 | $17,001 |
Similar Demographics by Median Household Income
Demographics Similar to Asians by Median Household Income
In terms of median household income, the demographic groups most similar to Asians are Eastern European ($101,781, a difference of 0.10%), Immigrants from Bolivia ($101,394, a difference of 0.28%), Bolivian ($102,195, a difference of 0.50%), Immigrants from Australia ($102,562, a difference of 0.87%), and Immigrants from Japan ($100,711, a difference of 0.96%).
| Demographics | Rating | Rank | Median Household Income |
| Immigrants | Israel | 100.0 /100 | #15 | Exceptional $104,090 |
| Burmese | 100.0 /100 | #16 | Exceptional $103,145 |
| Immigrants | Korea | 100.0 /100 | #17 | Exceptional $102,962 |
| Cypriots | 100.0 /100 | #18 | Exceptional $102,843 |
| Immigrants | Australia | 100.0 /100 | #19 | Exceptional $102,562 |
| Bolivians | 100.0 /100 | #20 | Exceptional $102,195 |
| Eastern Europeans | 100.0 /100 | #21 | Exceptional $101,781 |
| Asians | 100.0 /100 | #22 | Exceptional $101,681 |
| Immigrants | Bolivia | 100.0 /100 | #23 | Exceptional $101,394 |
| Immigrants | Japan | 100.0 /100 | #24 | Exceptional $100,711 |
| Immigrants | Sweden | 100.0 /100 | #25 | Exceptional $100,699 |
| Immigrants | Belgium | 100.0 /100 | #26 | Exceptional $100,306 |
| Bhutanese | 100.0 /100 | #27 | Exceptional $100,151 |
| Immigrants | Sri Lanka | 100.0 /100 | #28 | Exceptional $99,943 |
| Immigrants | Asia | 100.0 /100 | #29 | Exceptional $99,933 |
Demographics Similar to Mexican American Indians by Median Household Income
In terms of median household income, the demographic groups most similar to Mexican American Indians are Immigrants from Laos ($78,327, a difference of 0.21%), Immigrants from West Indies ($77,956, a difference of 0.27%), West Indian ($78,455, a difference of 0.37%), Sudanese ($78,529, a difference of 0.46%), and Immigrants from St. Vincent and the Grenadines ($77,690, a difference of 0.61%).
| Demographics | Rating | Rank | Median Household Income |
| Marshallese | 1.9 /100 | #244 | Tragic $78,930 |
| Inupiat | 1.8 /100 | #245 | Tragic $78,841 |
| Central Americans | 1.7 /100 | #246 | Tragic $78,803 |
| Immigrants | Burma/Myanmar | 1.6 /100 | #247 | Tragic $78,682 |
| Sudanese | 1.5 /100 | #248 | Tragic $78,529 |
| West Indians | 1.4 /100 | #249 | Tragic $78,455 |
| Immigrants | Laos | 1.3 /100 | #250 | Tragic $78,327 |
| Mexican American Indians | 1.2 /100 | #251 | Tragic $78,166 |
| Immigrants | West Indies | 1.0 /100 | #252 | Tragic $77,956 |
| Immigrants | St. Vincent and the Grenadines | 0.9 /100 | #253 | Tragic $77,690 |
| Sub-Saharan Africans | 0.8 /100 | #254 | Tragic $77,631 |
| Immigrants | Middle Africa | 0.8 /100 | #255 | Tragic $77,559 |
| Belizeans | 0.6 /100 | #256 | Tragic $77,028 |
| Immigrants | Senegal | 0.5 /100 | #257 | Tragic $76,915 |
| Immigrants | Nicaragua | 0.5 /100 | #258 | Tragic $76,784 |