Asian vs Lebanese Median Household Income
COMPARE
Asian
Lebanese
Median Household Income
Median Household Income Comparison
Asians
Lebanese
$101,681
MEDIAN HOUSEHOLD INCOME
100.0/ 100
METRIC RATING
22nd/ 347
METRIC RANK
$88,091
MEDIAN HOUSEHOLD INCOME
87.2/ 100
METRIC RATING
140th/ 347
METRIC RANK
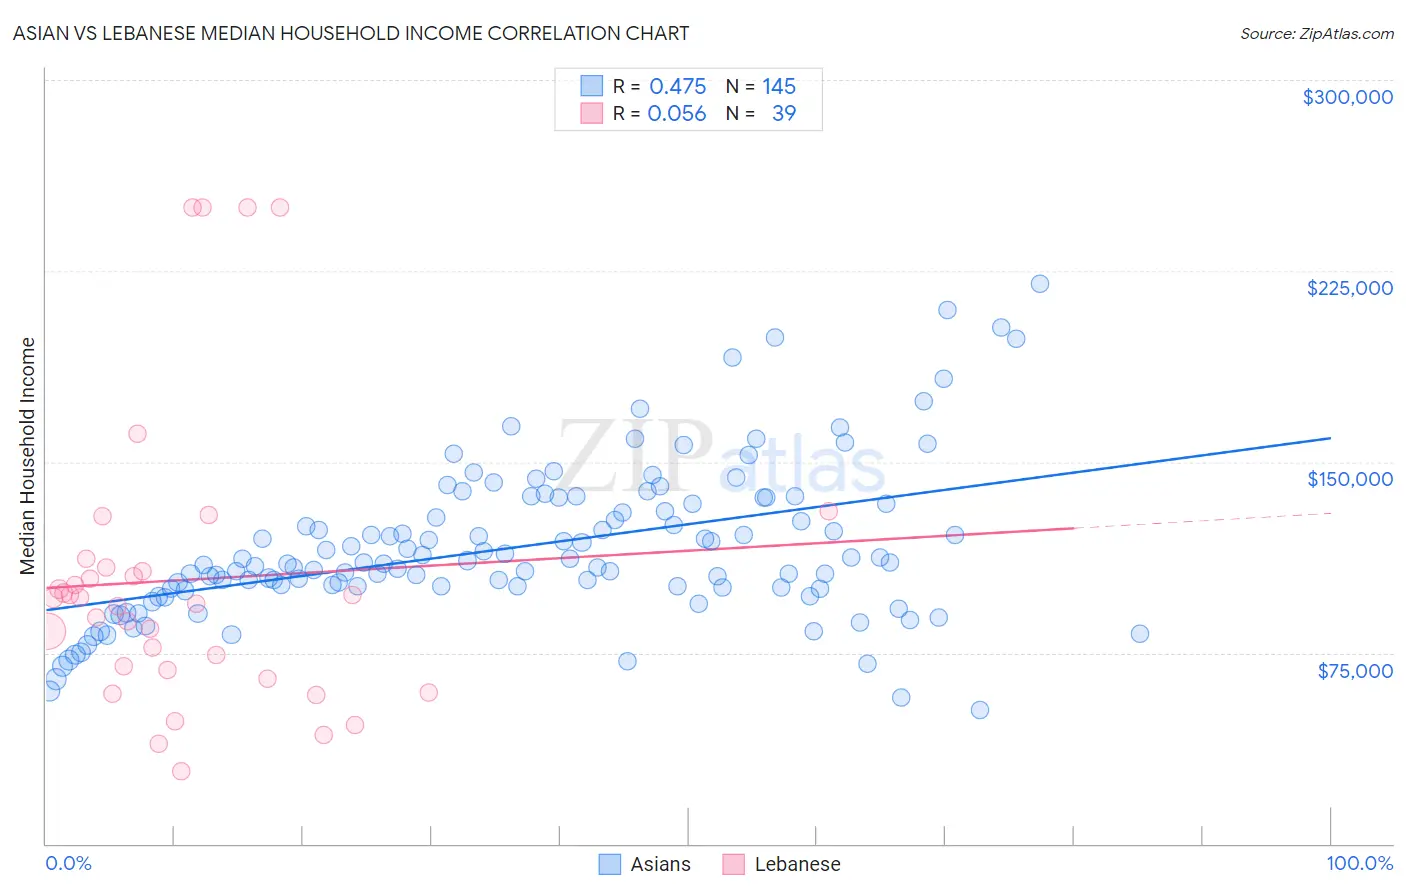
Asian vs Lebanese Median Household Income Correlation Chart
The statistical analysis conducted on geographies consisting of 549,980,753 people shows a moderate positive correlation between the proportion of Asians and median household income in the United States with a correlation coefficient (R) of 0.475 and weighted average of $101,681. Similarly, the statistical analysis conducted on geographies consisting of 401,232,119 people shows a slight positive correlation between the proportion of Lebanese and median household income in the United States with a correlation coefficient (R) of 0.056 and weighted average of $88,091, a difference of 15.4%.
Median Household Income Correlation Summary
| Measurement | Asian | Lebanese |
| Minimum | $52,658 | $28,348 |
| Maximum | $219,913 | $250,001 |
| Range | $167,255 | $221,653 |
| Mean | $116,419 | $103,665 |
| Median | $110,126 | $96,621 |
| Interquartile 25% (IQ1) | $100,433 | $68,125 |
| Interquartile 75% (IQ3) | $133,482 | $108,387 |
| Interquartile Range (IQR) | $33,049 | $40,262 |
| Standard Deviation (Sample) | $30,496 | $57,143 |
| Standard Deviation (Population) | $30,391 | $56,406 |
Similar Demographics by Median Household Income
Demographics Similar to Asians by Median Household Income
In terms of median household income, the demographic groups most similar to Asians are Eastern European ($101,781, a difference of 0.10%), Immigrants from Bolivia ($101,394, a difference of 0.28%), Bolivian ($102,195, a difference of 0.50%), Immigrants from Australia ($102,562, a difference of 0.87%), and Immigrants from Japan ($100,711, a difference of 0.96%).
| Demographics | Rating | Rank | Median Household Income |
| Immigrants | Israel | 100.0 /100 | #15 | Exceptional $104,090 |
| Burmese | 100.0 /100 | #16 | Exceptional $103,145 |
| Immigrants | Korea | 100.0 /100 | #17 | Exceptional $102,962 |
| Cypriots | 100.0 /100 | #18 | Exceptional $102,843 |
| Immigrants | Australia | 100.0 /100 | #19 | Exceptional $102,562 |
| Bolivians | 100.0 /100 | #20 | Exceptional $102,195 |
| Eastern Europeans | 100.0 /100 | #21 | Exceptional $101,781 |
| Asians | 100.0 /100 | #22 | Exceptional $101,681 |
| Immigrants | Bolivia | 100.0 /100 | #23 | Exceptional $101,394 |
| Immigrants | Japan | 100.0 /100 | #24 | Exceptional $100,711 |
| Immigrants | Sweden | 100.0 /100 | #25 | Exceptional $100,699 |
| Immigrants | Belgium | 100.0 /100 | #26 | Exceptional $100,306 |
| Bhutanese | 100.0 /100 | #27 | Exceptional $100,151 |
| Immigrants | Sri Lanka | 100.0 /100 | #28 | Exceptional $99,943 |
| Immigrants | Asia | 100.0 /100 | #29 | Exceptional $99,933 |
Demographics Similar to Lebanese by Median Household Income
In terms of median household income, the demographic groups most similar to Lebanese are Immigrants from Morocco ($87,930, a difference of 0.18%), Immigrants from Chile ($88,388, a difference of 0.34%), Arab ($88,398, a difference of 0.35%), Canadian ($87,769, a difference of 0.37%), and Sierra Leonean ($88,463, a difference of 0.42%).
| Demographics | Rating | Rank | Median Household Income |
| Immigrants | Ethiopia | 90.9 /100 | #133 | Exceptional $88,687 |
| Swedes | 90.0 /100 | #134 | Exceptional $88,524 |
| Immigrants | Sierra Leone | 89.9 /100 | #135 | Excellent $88,498 |
| Poles | 89.7 /100 | #136 | Excellent $88,472 |
| Sierra Leoneans | 89.6 /100 | #137 | Excellent $88,463 |
| Arabs | 89.2 /100 | #138 | Excellent $88,398 |
| Immigrants | Chile | 89.2 /100 | #139 | Excellent $88,388 |
| Lebanese | 87.2 /100 | #140 | Excellent $88,091 |
| Immigrants | Morocco | 86.0 /100 | #141 | Excellent $87,930 |
| Canadians | 84.7 /100 | #142 | Excellent $87,769 |
| Danes | 83.9 /100 | #143 | Excellent $87,676 |
| Serbians | 83.0 /100 | #144 | Excellent $87,572 |
| Ugandans | 82.9 /100 | #145 | Excellent $87,557 |
| Immigrants | Uganda | 82.8 /100 | #146 | Excellent $87,553 |
| South American Indians | 81.8 /100 | #147 | Excellent $87,446 |