Arapaho vs Chickasaw Seniors Poverty Over the Age of 65
COMPARE
Arapaho
Chickasaw
Seniors Poverty Over the Age of 65
Seniors Poverty Over the Age of 65 Comparison
Arapaho
Chickasaw
11.6%
SENIORS POVERTY OVER THE AGE OF 65
5.2/ 100
METRIC RATING
219th/ 347
METRIC RANK
10.7%
SENIORS POVERTY OVER THE AGE OF 65
73.6/ 100
METRIC RATING
155th/ 347
METRIC RANK
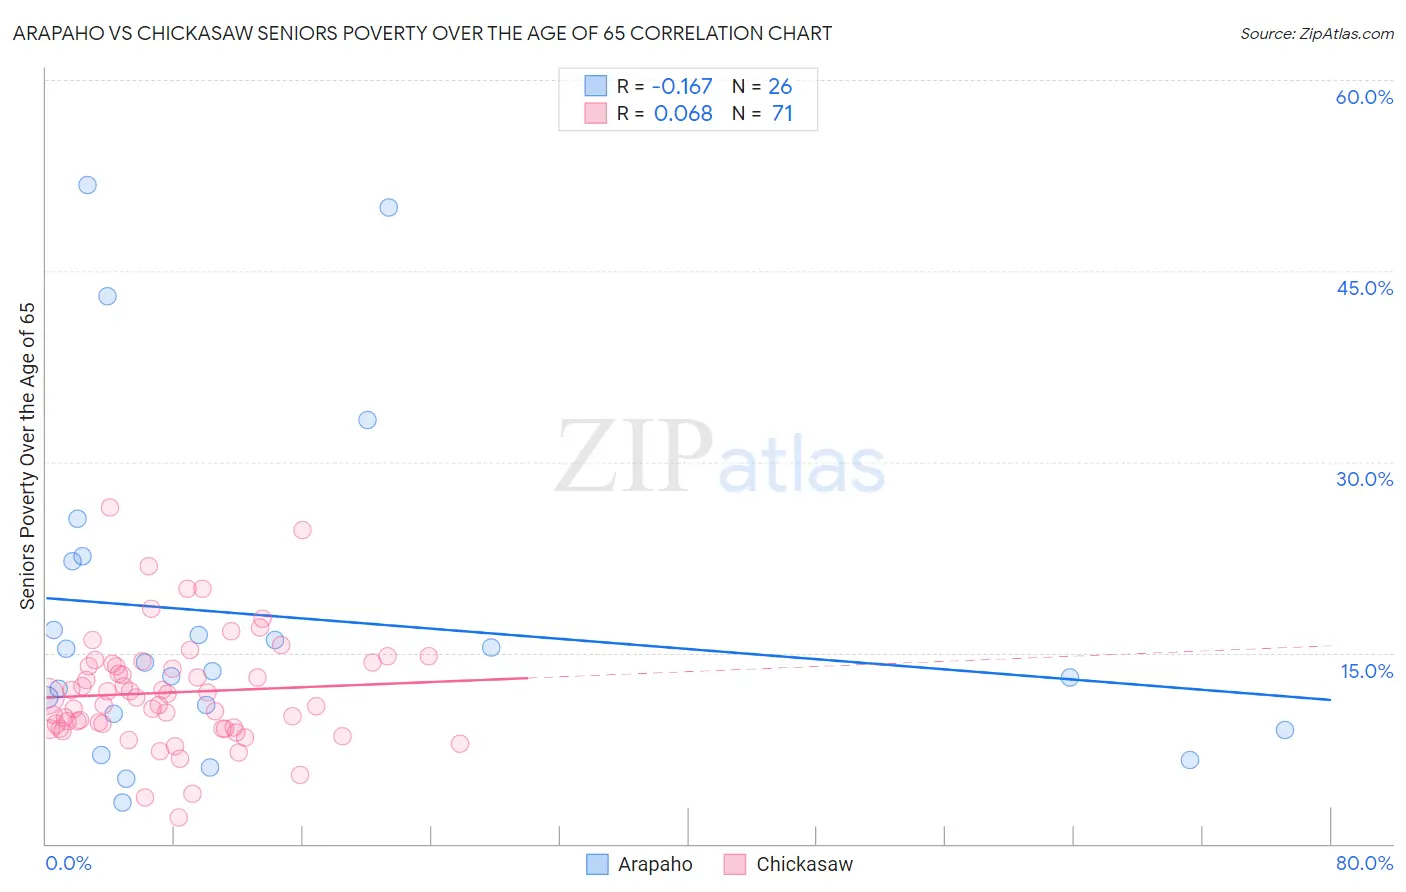
Arapaho vs Chickasaw Seniors Poverty Over the Age of 65 Correlation Chart
The statistical analysis conducted on geographies consisting of 29,765,884 people shows a poor negative correlation between the proportion of Arapaho and poverty level among seniors over the age of 65 in the United States with a correlation coefficient (R) of -0.167 and weighted average of 11.6%. Similarly, the statistical analysis conducted on geographies consisting of 147,403,073 people shows a slight positive correlation between the proportion of Chickasaw and poverty level among seniors over the age of 65 in the United States with a correlation coefficient (R) of 0.068 and weighted average of 10.7%, a difference of 8.9%.
Seniors Poverty Over the Age of 65 Correlation Summary
| Measurement | Arapaho | Chickasaw |
| Minimum | 3.2% | 2.1% |
| Maximum | 51.7% | 26.4% |
| Range | 48.5% | 24.4% |
| Mean | 17.8% | 11.9% |
| Median | 13.9% | 11.5% |
| Interquartile 25% (IQ1) | 10.2% | 9.1% |
| Interquartile 75% (IQ3) | 22.2% | 14.2% |
| Interquartile Range (IQR) | 12.0% | 5.1% |
| Standard Deviation (Sample) | 13.1% | 4.4% |
| Standard Deviation (Population) | 12.8% | 4.4% |
Similar Demographics by Seniors Poverty Over the Age of 65
Demographics Similar to Arapaho by Seniors Poverty Over the Age of 65
In terms of seniors poverty over the age of 65, the demographic groups most similar to Arapaho are Immigrants from Ukraine (11.6%, a difference of 0.18%), Immigrants from Africa (11.6%, a difference of 0.45%), Peruvian (11.7%, a difference of 0.48%), Argentinean (11.7%, a difference of 0.55%), and Immigrants from Morocco (11.6%, a difference of 0.59%).
| Demographics | Rating | Rank | Seniors Poverty Over the Age of 65 |
| Immigrants | China | 9.5 /100 | #212 | Tragic 11.5% |
| Nepalese | 8.9 /100 | #213 | Tragic 11.5% |
| Immigrants | Russia | 8.8 /100 | #214 | Tragic 11.5% |
| French American Indians | 8.7 /100 | #215 | Tragic 11.5% |
| Immigrants | Morocco | 6.8 /100 | #216 | Tragic 11.6% |
| Immigrants | Africa | 6.4 /100 | #217 | Tragic 11.6% |
| Immigrants | Ukraine | 5.7 /100 | #218 | Tragic 11.6% |
| Arapaho | 5.2 /100 | #219 | Tragic 11.6% |
| Peruvians | 4.2 /100 | #220 | Tragic 11.7% |
| Argentineans | 4.1 /100 | #221 | Tragic 11.7% |
| Immigrants | Chile | 3.9 /100 | #222 | Tragic 11.7% |
| Immigrants | Congo | 3.8 /100 | #223 | Tragic 11.7% |
| Immigrants | Nigeria | 3.4 /100 | #224 | Tragic 11.7% |
| Immigrants | Belarus | 3.2 /100 | #225 | Tragic 11.8% |
| Liberians | 3.2 /100 | #226 | Tragic 11.8% |
Demographics Similar to Chickasaw by Seniors Poverty Over the Age of 65
In terms of seniors poverty over the age of 65, the demographic groups most similar to Chickasaw are Ethiopian (10.7%, a difference of 0.070%), Immigrants from Ethiopia (10.7%, a difference of 0.080%), Immigrants from Saudi Arabia (10.7%, a difference of 0.16%), Immigrants from Sierra Leone (10.7%, a difference of 0.22%), and Fijian (10.7%, a difference of 0.24%).
| Demographics | Rating | Rank | Seniors Poverty Over the Age of 65 |
| Americans | 78.1 /100 | #148 | Good 10.6% |
| Immigrants | Cameroon | 78.1 /100 | #149 | Good 10.6% |
| Immigrants | Switzerland | 77.3 /100 | #150 | Good 10.6% |
| Spanish | 76.8 /100 | #151 | Good 10.6% |
| Immigrants | Egypt | 76.5 /100 | #152 | Good 10.6% |
| Fijians | 75.6 /100 | #153 | Good 10.7% |
| Immigrants | Saudi Arabia | 74.9 /100 | #154 | Good 10.7% |
| Chickasaw | 73.6 /100 | #155 | Good 10.7% |
| Ethiopians | 72.9 /100 | #156 | Good 10.7% |
| Immigrants | Ethiopia | 72.9 /100 | #157 | Good 10.7% |
| Immigrants | Sierra Leone | 71.7 /100 | #158 | Good 10.7% |
| Immigrants | Micronesia | 70.8 /100 | #159 | Good 10.7% |
| Sudanese | 68.2 /100 | #160 | Good 10.7% |
| Arabs | 65.2 /100 | #161 | Good 10.8% |
| Immigrants | Indonesia | 64.8 /100 | #162 | Good 10.8% |