Black/African American vs Immigrants from Turkey Median Female Earnings
COMPARE
Black/African American
Immigrants from Turkey
Median Female Earnings
Median Female Earnings Comparison
Blacks/African Americans
Immigrants from Turkey
$35,315
MEDIAN FEMALE EARNINGS
0.0/ 100
METRIC RATING
302nd/ 347
METRIC RANK
$44,066
MEDIAN FEMALE EARNINGS
100.0/ 100
METRIC RATING
36th/ 347
METRIC RANK
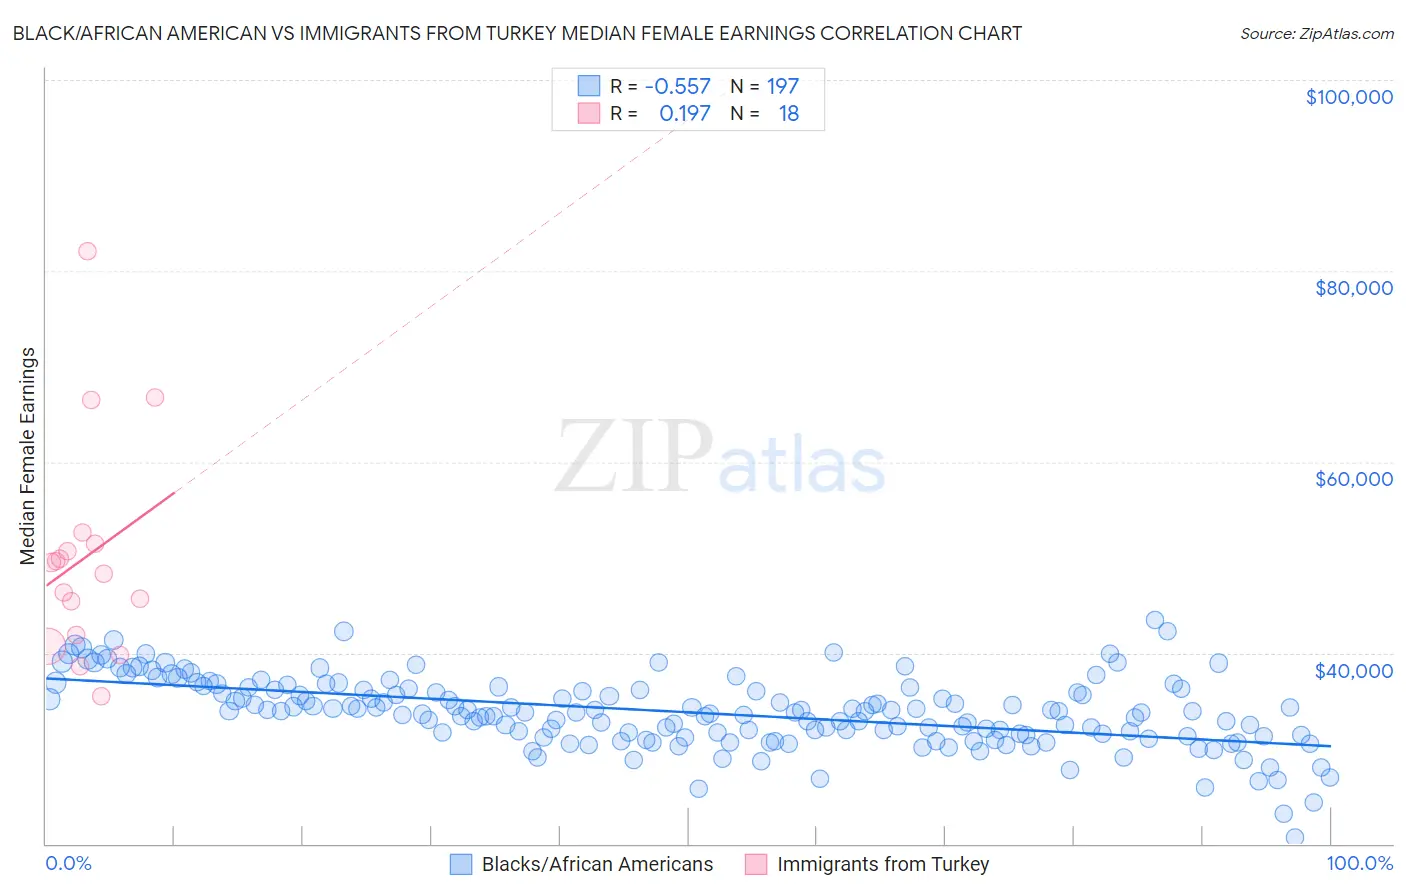
Black/African American vs Immigrants from Turkey Median Female Earnings Correlation Chart
The statistical analysis conducted on geographies consisting of 562,880,101 people shows a substantial negative correlation between the proportion of Blacks/African Americans and median female earnings in the United States with a correlation coefficient (R) of -0.557 and weighted average of $35,315. Similarly, the statistical analysis conducted on geographies consisting of 223,023,640 people shows a poor positive correlation between the proportion of Immigrants from Turkey and median female earnings in the United States with a correlation coefficient (R) of 0.197 and weighted average of $44,066, a difference of 24.8%.
Median Female Earnings Correlation Summary
| Measurement | Black/African American | Immigrants from Turkey |
| Minimum | $20,616 | $35,410 |
| Maximum | $43,481 | $82,017 |
| Range | $22,865 | $46,607 |
| Mean | $33,784 | $50,062 |
| Median | $33,890 | $48,920 |
| Interquartile 25% (IQ1) | $31,353 | $41,873 |
| Interquartile 75% (IQ3) | $36,250 | $51,472 |
| Interquartile Range (IQR) | $4,897 | $9,599 |
| Standard Deviation (Sample) | $3,688 | $11,491 |
| Standard Deviation (Population) | $3,678 | $11,167 |
Similar Demographics by Median Female Earnings
Demographics Similar to Blacks/African Americans by Median Female Earnings
In terms of median female earnings, the demographic groups most similar to Blacks/African Americans are Immigrants from Latin America ($35,307, a difference of 0.020%), Pima ($35,326, a difference of 0.030%), Crow ($35,266, a difference of 0.14%), Yuman ($35,377, a difference of 0.18%), and Immigrants from Guatemala ($35,444, a difference of 0.36%).
| Demographics | Rating | Rank | Median Female Earnings |
| Comanche | 0.0 /100 | #295 | Tragic $35,661 |
| Mexican American Indians | 0.0 /100 | #296 | Tragic $35,629 |
| Hmong | 0.0 /100 | #297 | Tragic $35,498 |
| Immigrants | Micronesia | 0.0 /100 | #298 | Tragic $35,477 |
| Immigrants | Guatemala | 0.0 /100 | #299 | Tragic $35,444 |
| Yuman | 0.0 /100 | #300 | Tragic $35,377 |
| Pima | 0.0 /100 | #301 | Tragic $35,326 |
| Blacks/African Americans | 0.0 /100 | #302 | Tragic $35,315 |
| Immigrants | Latin America | 0.0 /100 | #303 | Tragic $35,307 |
| Crow | 0.0 /100 | #304 | Tragic $35,266 |
| Bahamians | 0.0 /100 | #305 | Tragic $35,125 |
| Fijians | 0.0 /100 | #306 | Tragic $35,114 |
| Sioux | 0.0 /100 | #307 | Tragic $35,063 |
| Immigrants | Bahamas | 0.0 /100 | #308 | Tragic $35,027 |
| Hondurans | 0.0 /100 | #309 | Tragic $35,013 |
Demographics Similar to Immigrants from Turkey by Median Female Earnings
In terms of median female earnings, the demographic groups most similar to Immigrants from Turkey are Immigrants from Switzerland ($43,996, a difference of 0.16%), Immigrants from Sri Lanka ($44,161, a difference of 0.21%), Russian ($44,169, a difference of 0.23%), Latvian ($43,941, a difference of 0.28%), and Immigrants from Asia ($44,198, a difference of 0.30%).
| Demographics | Rating | Rank | Median Female Earnings |
| Immigrants | Belgium | 100.0 /100 | #29 | Exceptional $44,587 |
| Asians | 100.0 /100 | #30 | Exceptional $44,586 |
| Immigrants | France | 100.0 /100 | #31 | Exceptional $44,541 |
| Immigrants | Northern Europe | 100.0 /100 | #32 | Exceptional $44,366 |
| Immigrants | Asia | 100.0 /100 | #33 | Exceptional $44,198 |
| Russians | 100.0 /100 | #34 | Exceptional $44,169 |
| Immigrants | Sri Lanka | 100.0 /100 | #35 | Exceptional $44,161 |
| Immigrants | Turkey | 100.0 /100 | #36 | Exceptional $44,066 |
| Immigrants | Switzerland | 100.0 /100 | #37 | Exceptional $43,996 |
| Latvians | 100.0 /100 | #38 | Exceptional $43,941 |
| Israelis | 100.0 /100 | #39 | Exceptional $43,852 |
| Immigrants | Malaysia | 100.0 /100 | #40 | Exceptional $43,835 |
| Bhutanese | 100.0 /100 | #41 | Exceptional $43,648 |
| Immigrants | Denmark | 100.0 /100 | #42 | Exceptional $43,646 |
| Bulgarians | 100.0 /100 | #43 | Exceptional $43,638 |