Pueblo vs Immigrants from Turkey Median Female Earnings
COMPARE
Pueblo
Immigrants from Turkey
Median Female Earnings
Median Female Earnings Comparison
Pueblo
Immigrants from Turkey
$32,564
MEDIAN FEMALE EARNINGS
0.0/ 100
METRIC RATING
343rd/ 347
METRIC RANK
$44,066
MEDIAN FEMALE EARNINGS
100.0/ 100
METRIC RATING
36th/ 347
METRIC RANK
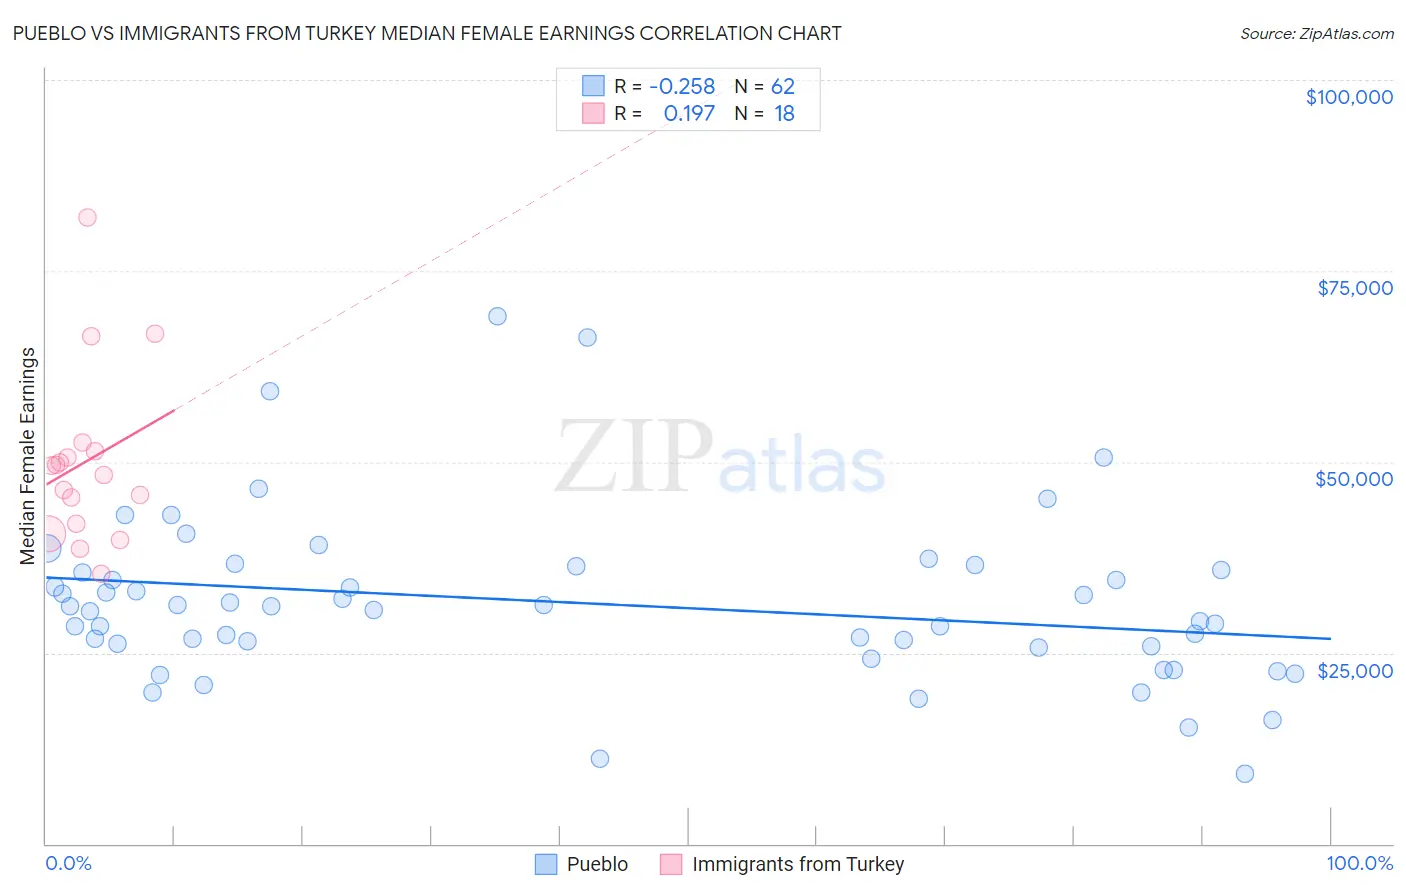
Pueblo vs Immigrants from Turkey Median Female Earnings Correlation Chart
The statistical analysis conducted on geographies consisting of 120,036,612 people shows a weak negative correlation between the proportion of Pueblo and median female earnings in the United States with a correlation coefficient (R) of -0.258 and weighted average of $32,564. Similarly, the statistical analysis conducted on geographies consisting of 223,023,640 people shows a poor positive correlation between the proportion of Immigrants from Turkey and median female earnings in the United States with a correlation coefficient (R) of 0.197 and weighted average of $44,066, a difference of 35.3%.
Median Female Earnings Correlation Summary
| Measurement | Pueblo | Immigrants from Turkey |
| Minimum | $9,219 | $35,410 |
| Maximum | $69,074 | $82,017 |
| Range | $59,855 | $46,607 |
| Mean | $31,512 | $50,062 |
| Median | $30,863 | $48,920 |
| Interquartile 25% (IQ1) | $25,792 | $41,873 |
| Interquartile 75% (IQ3) | $35,833 | $51,472 |
| Interquartile Range (IQR) | $10,041 | $9,599 |
| Standard Deviation (Sample) | $11,084 | $11,491 |
| Standard Deviation (Population) | $10,994 | $11,167 |
Similar Demographics by Median Female Earnings
Demographics Similar to Pueblo by Median Female Earnings
In terms of median female earnings, the demographic groups most similar to Pueblo are Lumbee ($32,500, a difference of 0.20%), Yup'ik ($32,730, a difference of 0.51%), Navajo ($33,046, a difference of 1.5%), Tohono O'odham ($33,205, a difference of 2.0%), and Immigrants from Mexico ($33,236, a difference of 2.1%).
| Demographics | Rating | Rank | Median Female Earnings |
| Mexicans | 0.0 /100 | #333 | Tragic $33,664 |
| Spanish American Indians | 0.0 /100 | #334 | Tragic $33,625 |
| Creek | 0.0 /100 | #335 | Tragic $33,437 |
| Ottawa | 0.0 /100 | #336 | Tragic $33,378 |
| Yakama | 0.0 /100 | #337 | Tragic $33,354 |
| Immigrants | Cuba | 0.0 /100 | #338 | Tragic $33,291 |
| Immigrants | Mexico | 0.0 /100 | #339 | Tragic $33,236 |
| Tohono O'odham | 0.0 /100 | #340 | Tragic $33,205 |
| Navajo | 0.0 /100 | #341 | Tragic $33,046 |
| Yup'ik | 0.0 /100 | #342 | Tragic $32,730 |
| Pueblo | 0.0 /100 | #343 | Tragic $32,564 |
| Lumbee | 0.0 /100 | #344 | Tragic $32,500 |
| Puerto Ricans | 0.0 /100 | #345 | Tragic $31,560 |
| Arapaho | 0.0 /100 | #346 | Tragic $31,489 |
| Houma | 0.0 /100 | #347 | Tragic $30,343 |
Demographics Similar to Immigrants from Turkey by Median Female Earnings
In terms of median female earnings, the demographic groups most similar to Immigrants from Turkey are Immigrants from Switzerland ($43,996, a difference of 0.16%), Immigrants from Sri Lanka ($44,161, a difference of 0.21%), Russian ($44,169, a difference of 0.23%), Latvian ($43,941, a difference of 0.28%), and Immigrants from Asia ($44,198, a difference of 0.30%).
| Demographics | Rating | Rank | Median Female Earnings |
| Immigrants | Belgium | 100.0 /100 | #29 | Exceptional $44,587 |
| Asians | 100.0 /100 | #30 | Exceptional $44,586 |
| Immigrants | France | 100.0 /100 | #31 | Exceptional $44,541 |
| Immigrants | Northern Europe | 100.0 /100 | #32 | Exceptional $44,366 |
| Immigrants | Asia | 100.0 /100 | #33 | Exceptional $44,198 |
| Russians | 100.0 /100 | #34 | Exceptional $44,169 |
| Immigrants | Sri Lanka | 100.0 /100 | #35 | Exceptional $44,161 |
| Immigrants | Turkey | 100.0 /100 | #36 | Exceptional $44,066 |
| Immigrants | Switzerland | 100.0 /100 | #37 | Exceptional $43,996 |
| Latvians | 100.0 /100 | #38 | Exceptional $43,941 |
| Israelis | 100.0 /100 | #39 | Exceptional $43,852 |
| Immigrants | Malaysia | 100.0 /100 | #40 | Exceptional $43,835 |
| Bhutanese | 100.0 /100 | #41 | Exceptional $43,648 |
| Immigrants | Denmark | 100.0 /100 | #42 | Exceptional $43,646 |
| Bulgarians | 100.0 /100 | #43 | Exceptional $43,638 |