Ute vs Immigrants from Turkey Median Female Earnings
COMPARE
Ute
Immigrants from Turkey
Median Female Earnings
Median Female Earnings Comparison
Ute
Immigrants from Turkey
$34,960
MEDIAN FEMALE EARNINGS
0.0/ 100
METRIC RATING
311th/ 347
METRIC RANK
$44,066
MEDIAN FEMALE EARNINGS
100.0/ 100
METRIC RATING
36th/ 347
METRIC RANK
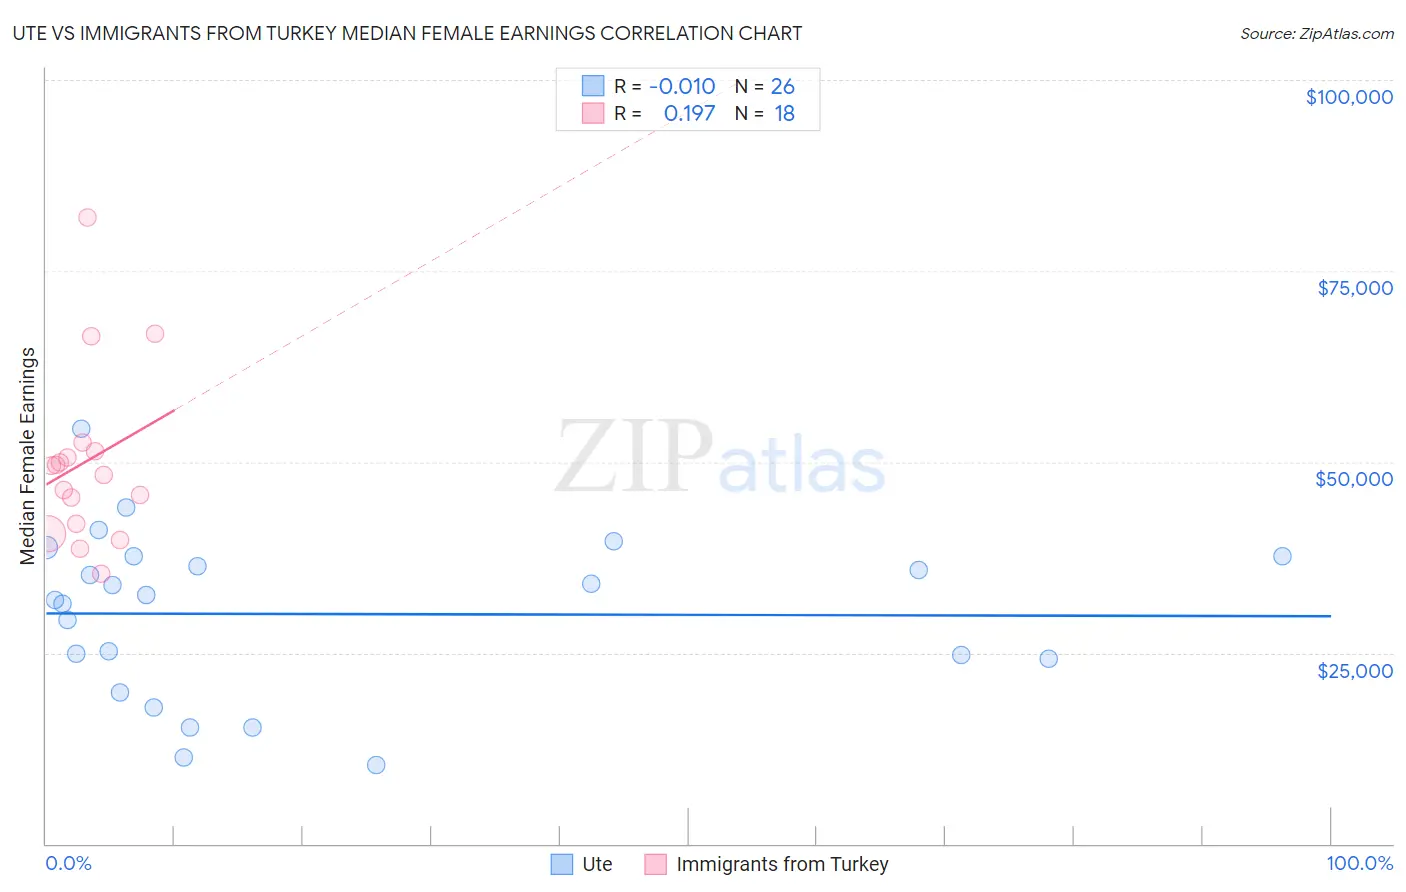
Ute vs Immigrants from Turkey Median Female Earnings Correlation Chart
The statistical analysis conducted on geographies consisting of 55,659,535 people shows no correlation between the proportion of Ute and median female earnings in the United States with a correlation coefficient (R) of -0.010 and weighted average of $34,960. Similarly, the statistical analysis conducted on geographies consisting of 223,023,640 people shows a poor positive correlation between the proportion of Immigrants from Turkey and median female earnings in the United States with a correlation coefficient (R) of 0.197 and weighted average of $44,066, a difference of 26.1%.
Median Female Earnings Correlation Summary
| Measurement | Ute | Immigrants from Turkey |
| Minimum | $10,250 | $35,410 |
| Maximum | $54,350 | $82,017 |
| Range | $44,100 | $46,607 |
| Mean | $30,088 | $50,062 |
| Median | $32,195 | $48,920 |
| Interquartile 25% (IQ1) | $24,148 | $41,873 |
| Interquartile 75% (IQ3) | $37,604 | $51,472 |
| Interquartile Range (IQR) | $13,456 | $9,599 |
| Standard Deviation (Sample) | $10,734 | $11,491 |
| Standard Deviation (Population) | $10,525 | $11,167 |
Similar Demographics by Median Female Earnings
Demographics Similar to Ute by Median Female Earnings
In terms of median female earnings, the demographic groups most similar to Ute are Yaqui ($34,943, a difference of 0.050%), Cuban ($34,942, a difference of 0.050%), Chippewa ($35,003, a difference of 0.12%), Honduran ($35,013, a difference of 0.15%), and Immigrants from Bahamas ($35,027, a difference of 0.19%).
| Demographics | Rating | Rank | Median Female Earnings |
| Crow | 0.0 /100 | #304 | Tragic $35,266 |
| Bahamians | 0.0 /100 | #305 | Tragic $35,125 |
| Fijians | 0.0 /100 | #306 | Tragic $35,114 |
| Sioux | 0.0 /100 | #307 | Tragic $35,063 |
| Immigrants | Bahamas | 0.0 /100 | #308 | Tragic $35,027 |
| Hondurans | 0.0 /100 | #309 | Tragic $35,013 |
| Chippewa | 0.0 /100 | #310 | Tragic $35,003 |
| Ute | 0.0 /100 | #311 | Tragic $34,960 |
| Yaqui | 0.0 /100 | #312 | Tragic $34,943 |
| Cubans | 0.0 /100 | #313 | Tragic $34,942 |
| Apache | 0.0 /100 | #314 | Tragic $34,895 |
| Pennsylvania Germans | 0.0 /100 | #315 | Tragic $34,802 |
| Cherokee | 0.0 /100 | #316 | Tragic $34,742 |
| Potawatomi | 0.0 /100 | #317 | Tragic $34,739 |
| Immigrants | Yemen | 0.0 /100 | #318 | Tragic $34,693 |
Demographics Similar to Immigrants from Turkey by Median Female Earnings
In terms of median female earnings, the demographic groups most similar to Immigrants from Turkey are Immigrants from Switzerland ($43,996, a difference of 0.16%), Immigrants from Sri Lanka ($44,161, a difference of 0.21%), Russian ($44,169, a difference of 0.23%), Latvian ($43,941, a difference of 0.28%), and Immigrants from Asia ($44,198, a difference of 0.30%).
| Demographics | Rating | Rank | Median Female Earnings |
| Immigrants | Belgium | 100.0 /100 | #29 | Exceptional $44,587 |
| Asians | 100.0 /100 | #30 | Exceptional $44,586 |
| Immigrants | France | 100.0 /100 | #31 | Exceptional $44,541 |
| Immigrants | Northern Europe | 100.0 /100 | #32 | Exceptional $44,366 |
| Immigrants | Asia | 100.0 /100 | #33 | Exceptional $44,198 |
| Russians | 100.0 /100 | #34 | Exceptional $44,169 |
| Immigrants | Sri Lanka | 100.0 /100 | #35 | Exceptional $44,161 |
| Immigrants | Turkey | 100.0 /100 | #36 | Exceptional $44,066 |
| Immigrants | Switzerland | 100.0 /100 | #37 | Exceptional $43,996 |
| Latvians | 100.0 /100 | #38 | Exceptional $43,941 |
| Israelis | 100.0 /100 | #39 | Exceptional $43,852 |
| Immigrants | Malaysia | 100.0 /100 | #40 | Exceptional $43,835 |
| Bhutanese | 100.0 /100 | #41 | Exceptional $43,648 |
| Immigrants | Denmark | 100.0 /100 | #42 | Exceptional $43,646 |
| Bulgarians | 100.0 /100 | #43 | Exceptional $43,638 |