Bolivian vs Immigrants from Turkey Median Female Earnings
COMPARE
Bolivian
Immigrants from Turkey
Median Female Earnings
Median Female Earnings Comparison
Bolivians
Immigrants from Turkey
$43,445
MEDIAN FEMALE EARNINGS
100.0/ 100
METRIC RATING
47th/ 347
METRIC RANK
$44,066
MEDIAN FEMALE EARNINGS
100.0/ 100
METRIC RATING
36th/ 347
METRIC RANK
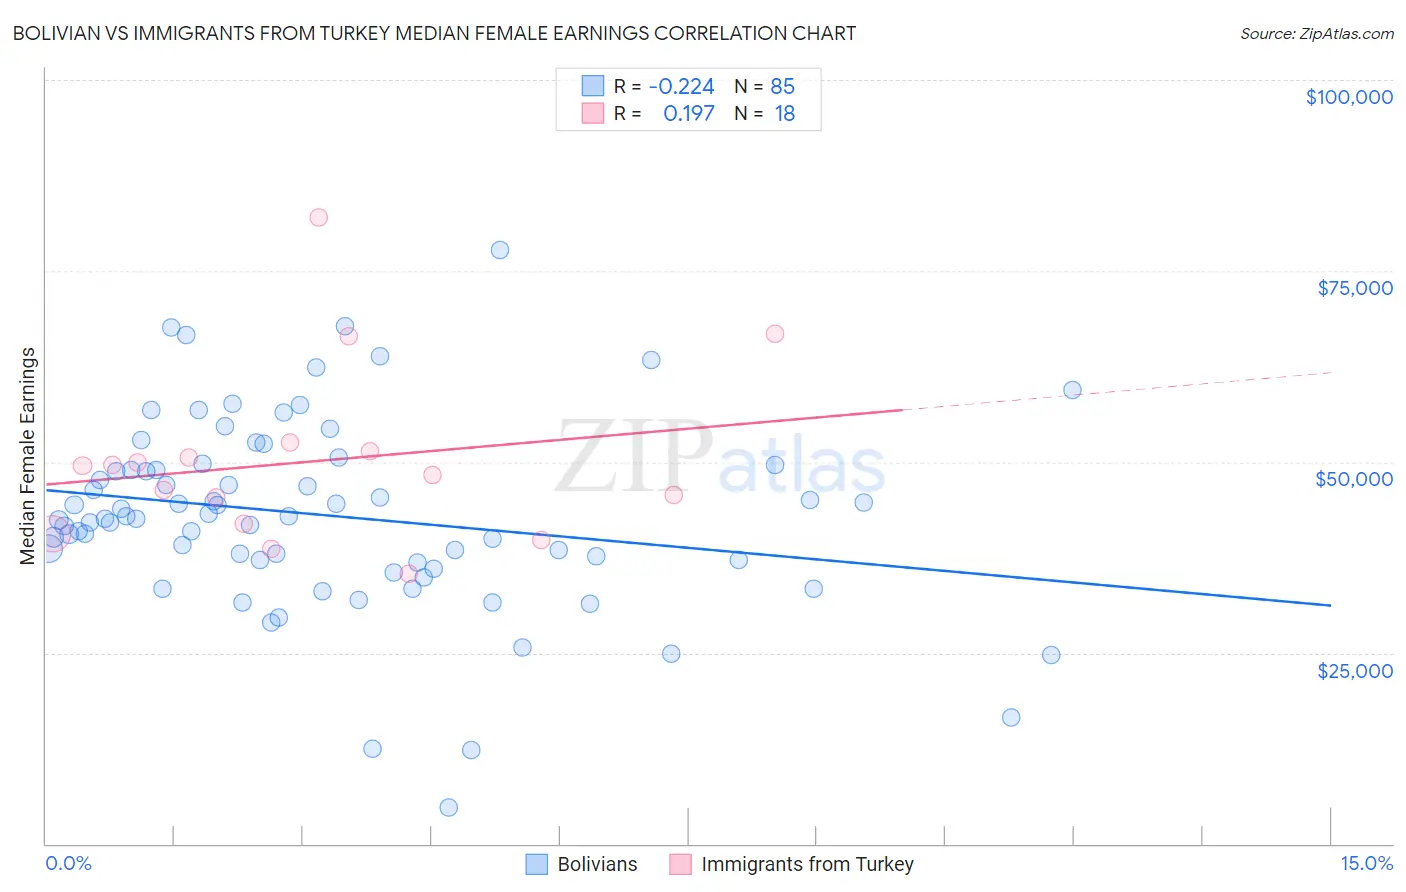
Bolivian vs Immigrants from Turkey Median Female Earnings Correlation Chart
The statistical analysis conducted on geographies consisting of 184,667,503 people shows a weak negative correlation between the proportion of Bolivians and median female earnings in the United States with a correlation coefficient (R) of -0.224 and weighted average of $43,445. Similarly, the statistical analysis conducted on geographies consisting of 223,023,640 people shows a poor positive correlation between the proportion of Immigrants from Turkey and median female earnings in the United States with a correlation coefficient (R) of 0.197 and weighted average of $44,066, a difference of 1.4%.
Median Female Earnings Correlation Summary
| Measurement | Bolivian | Immigrants from Turkey |
| Minimum | $4,682 | $35,410 |
| Maximum | $77,679 | $82,017 |
| Range | $72,997 | $46,607 |
| Mean | $42,989 | $50,062 |
| Median | $42,606 | $48,920 |
| Interquartile 25% (IQ1) | $36,934 | $41,873 |
| Interquartile 75% (IQ3) | $49,332 | $51,472 |
| Interquartile Range (IQR) | $12,397 | $9,599 |
| Standard Deviation (Sample) | $12,507 | $11,491 |
| Standard Deviation (Population) | $12,433 | $11,167 |
Demographics Similar to Bolivians and Immigrants from Turkey by Median Female Earnings
In terms of median female earnings, the demographic groups most similar to Bolivians are Immigrants from Bolivia ($43,467, a difference of 0.050%), Immigrants from Indonesia ($43,412, a difference of 0.070%), Immigrants from Serbia ($43,385, a difference of 0.14%), Immigrants from Europe ($43,523, a difference of 0.18%), and Immigrants from Uzbekistan ($43,363, a difference of 0.19%). Similarly, the demographic groups most similar to Immigrants from Turkey are Immigrants from Switzerland ($43,996, a difference of 0.16%), Immigrants from Sri Lanka ($44,161, a difference of 0.21%), Russian ($44,169, a difference of 0.23%), Latvian ($43,941, a difference of 0.28%), and Immigrants from Asia ($44,198, a difference of 0.30%).
| Demographics | Rating | Rank | Median Female Earnings |
| Immigrants | France | 100.0 /100 | #31 | Exceptional $44,541 |
| Immigrants | Northern Europe | 100.0 /100 | #32 | Exceptional $44,366 |
| Immigrants | Asia | 100.0 /100 | #33 | Exceptional $44,198 |
| Russians | 100.0 /100 | #34 | Exceptional $44,169 |
| Immigrants | Sri Lanka | 100.0 /100 | #35 | Exceptional $44,161 |
| Immigrants | Turkey | 100.0 /100 | #36 | Exceptional $44,066 |
| Immigrants | Switzerland | 100.0 /100 | #37 | Exceptional $43,996 |
| Latvians | 100.0 /100 | #38 | Exceptional $43,941 |
| Israelis | 100.0 /100 | #39 | Exceptional $43,852 |
| Immigrants | Malaysia | 100.0 /100 | #40 | Exceptional $43,835 |
| Bhutanese | 100.0 /100 | #41 | Exceptional $43,648 |
| Immigrants | Denmark | 100.0 /100 | #42 | Exceptional $43,646 |
| Bulgarians | 100.0 /100 | #43 | Exceptional $43,638 |
| Immigrants | Czechoslovakia | 100.0 /100 | #44 | Exceptional $43,571 |
| Immigrants | Europe | 100.0 /100 | #45 | Exceptional $43,523 |
| Immigrants | Bolivia | 100.0 /100 | #46 | Exceptional $43,467 |
| Bolivians | 100.0 /100 | #47 | Exceptional $43,445 |
| Immigrants | Indonesia | 100.0 /100 | #48 | Exceptional $43,412 |
| Immigrants | Serbia | 100.0 /100 | #49 | Exceptional $43,385 |
| Immigrants | Uzbekistan | 100.0 /100 | #50 | Exceptional $43,363 |
| Maltese | 100.0 /100 | #51 | Exceptional $43,357 |