Albanian vs Immigrants from West Indies Householder Income Ages 25 - 44 years
COMPARE
Albanian
Immigrants from West Indies
Householder Income Ages 25 - 44 years
Householder Income Ages 25 - 44 years Comparison
Albanians
Immigrants from West Indies
$101,367
HOUSEHOLDER INCOME AGES 25 - 44 YEARS
97.8/ 100
METRIC RATING
101st/ 347
METRIC RANK
$87,063
HOUSEHOLDER INCOME AGES 25 - 44 YEARS
1.5/ 100
METRIC RATING
243rd/ 347
METRIC RANK
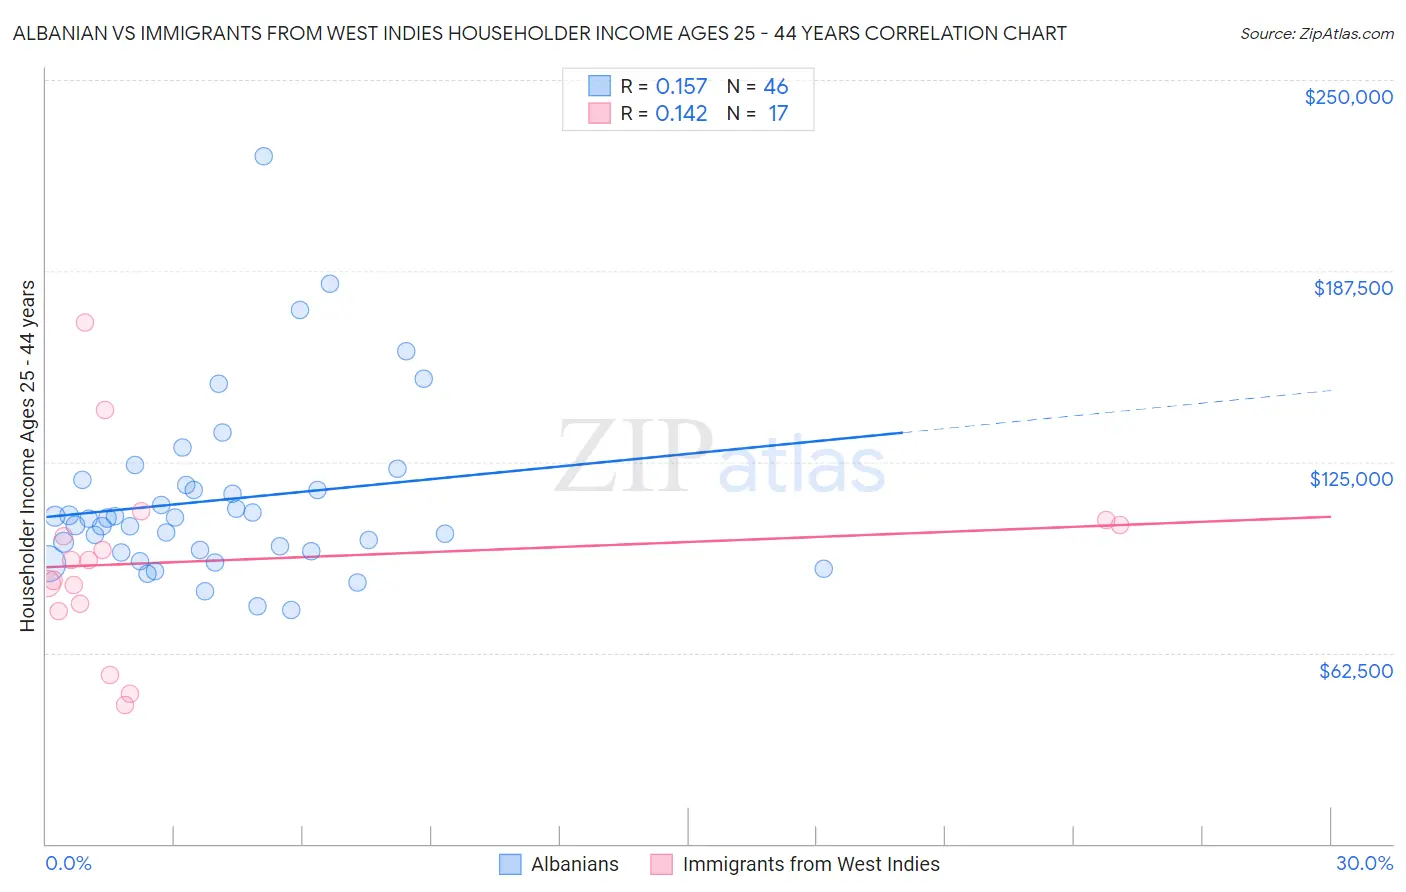
Albanian vs Immigrants from West Indies Householder Income Ages 25 - 44 years Correlation Chart
The statistical analysis conducted on geographies consisting of 193,076,288 people shows a poor positive correlation between the proportion of Albanians and household income with householder between the ages 25 and 44 in the United States with a correlation coefficient (R) of 0.157 and weighted average of $101,367. Similarly, the statistical analysis conducted on geographies consisting of 72,445,724 people shows a poor positive correlation between the proportion of Immigrants from West Indies and household income with householder between the ages 25 and 44 in the United States with a correlation coefficient (R) of 0.142 and weighted average of $87,063, a difference of 16.4%.
Householder Income Ages 25 - 44 years Correlation Summary
| Measurement | Albanian | Immigrants from West Indies |
| Minimum | $76,718 | $45,500 |
| Maximum | $225,000 | $170,707 |
| Range | $148,282 | $125,207 |
| Mean | $112,576 | $92,620 |
| Median | $106,494 | $92,679 |
| Interquartile 25% (IQ1) | $95,901 | $77,312 |
| Interquartile 75% (IQ3) | $117,313 | $105,207 |
| Interquartile Range (IQR) | $21,412 | $27,895 |
| Standard Deviation (Sample) | $28,766 | $30,962 |
| Standard Deviation (Population) | $28,452 | $30,037 |
Similar Demographics by Householder Income Ages 25 - 44 years
Demographics Similar to Albanians by Householder Income Ages 25 - 44 years
In terms of householder income ages 25 - 44 years, the demographic groups most similar to Albanians are Immigrants from Argentina ($101,415, a difference of 0.050%), Taiwanese ($101,492, a difference of 0.12%), Immigrants from Lebanon ($101,124, a difference of 0.24%), Immigrants from Moldova ($101,091, a difference of 0.27%), and Immigrants from Poland ($101,065, a difference of 0.30%).
| Demographics | Rating | Rank | Householder Income Ages 25 - 44 years |
| Sri Lankans | 98.4 /100 | #94 | Exceptional $101,960 |
| Assyrians/Chaldeans/Syriacs | 98.3 /100 | #95 | Exceptional $101,936 |
| Macedonians | 98.3 /100 | #96 | Exceptional $101,882 |
| Austrians | 98.3 /100 | #97 | Exceptional $101,842 |
| Immigrants | Kazakhstan | 98.1 /100 | #98 | Exceptional $101,727 |
| Taiwanese | 97.9 /100 | #99 | Exceptional $101,492 |
| Immigrants | Argentina | 97.8 /100 | #100 | Exceptional $101,415 |
| Albanians | 97.8 /100 | #101 | Exceptional $101,367 |
| Immigrants | Lebanon | 97.4 /100 | #102 | Exceptional $101,124 |
| Immigrants | Moldova | 97.4 /100 | #103 | Exceptional $101,091 |
| Immigrants | Poland | 97.4 /100 | #104 | Exceptional $101,065 |
| Immigrants | Vietnam | 96.5 /100 | #105 | Exceptional $100,535 |
| Immigrants | Brazil | 96.5 /100 | #106 | Exceptional $100,534 |
| Northern Europeans | 96.3 /100 | #107 | Exceptional $100,457 |
| Immigrants | South Eastern Asia | 96.0 /100 | #108 | Exceptional $100,283 |
Demographics Similar to Immigrants from West Indies by Householder Income Ages 25 - 44 years
In terms of householder income ages 25 - 44 years, the demographic groups most similar to Immigrants from West Indies are Immigrants from Venezuela ($87,038, a difference of 0.030%), West Indian ($87,205, a difference of 0.16%), Immigrants from El Salvador ($86,913, a difference of 0.17%), Immigrants from Burma/Myanmar ($86,736, a difference of 0.38%), and Immigrants from Nigeria ($86,589, a difference of 0.55%).
| Demographics | Rating | Rank | Householder Income Ages 25 - 44 years |
| Immigrants | Cameroon | 2.9 /100 | #236 | Tragic $88,214 |
| Salvadorans | 2.8 /100 | #237 | Tragic $88,198 |
| Alaska Natives | 2.6 /100 | #238 | Tragic $88,018 |
| Immigrants | Ghana | 2.2 /100 | #239 | Tragic $87,760 |
| Nicaraguans | 2.2 /100 | #240 | Tragic $87,751 |
| Nigerians | 2.2 /100 | #241 | Tragic $87,730 |
| West Indians | 1.7 /100 | #242 | Tragic $87,205 |
| Immigrants | West Indies | 1.5 /100 | #243 | Tragic $87,063 |
| Immigrants | Venezuela | 1.5 /100 | #244 | Tragic $87,038 |
| Immigrants | El Salvador | 1.4 /100 | #245 | Tragic $86,913 |
| Immigrants | Burma/Myanmar | 1.3 /100 | #246 | Tragic $86,736 |
| Immigrants | Nigeria | 1.2 /100 | #247 | Tragic $86,589 |
| Immigrants | Sudan | 0.9 /100 | #248 | Tragic $86,109 |
| French American Indians | 0.8 /100 | #249 | Tragic $85,899 |
| Pennsylvania Germans | 0.8 /100 | #250 | Tragic $85,836 |