Albanian vs Immigrants from Bulgaria Median Earnings
COMPARE
Albanian
Immigrants from Bulgaria
Median Earnings
Median Earnings Comparison
Albanians
Immigrants from Bulgaria
$50,116
MEDIAN EARNINGS
99.4/ 100
METRIC RATING
88th/ 347
METRIC RANK
$51,318
MEDIAN EARNINGS
99.9/ 100
METRIC RATING
63rd/ 347
METRIC RANK
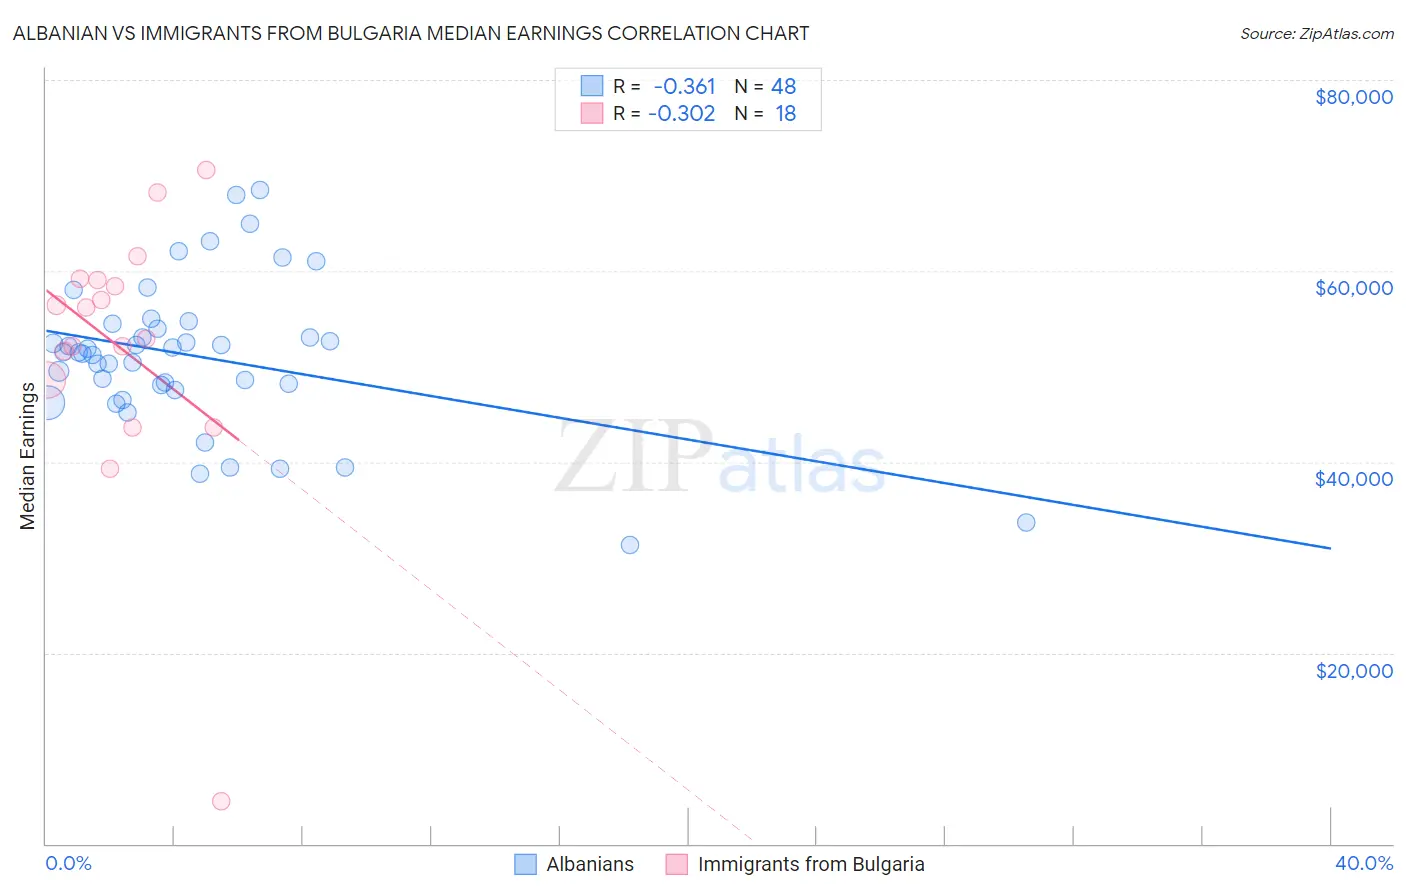
Albanian vs Immigrants from Bulgaria Median Earnings Correlation Chart
The statistical analysis conducted on geographies consisting of 193,255,601 people shows a mild negative correlation between the proportion of Albanians and median earnings in the United States with a correlation coefficient (R) of -0.361 and weighted average of $50,116. Similarly, the statistical analysis conducted on geographies consisting of 172,536,651 people shows a mild negative correlation between the proportion of Immigrants from Bulgaria and median earnings in the United States with a correlation coefficient (R) of -0.302 and weighted average of $51,318, a difference of 2.4%.
Median Earnings Correlation Summary
| Measurement | Albanian | Immigrants from Bulgaria |
| Minimum | $31,250 | $4,447 |
| Maximum | $68,474 | $70,600 |
| Range | $37,224 | $66,153 |
| Mean | $51,050 | $51,928 |
| Median | $51,491 | $54,557 |
| Interquartile 25% (IQ1) | $47,850 | $48,616 |
| Interquartile 75% (IQ3) | $54,177 | $58,987 |
| Interquartile Range (IQR) | $6,327 | $10,371 |
| Standard Deviation (Sample) | $7,882 | $14,304 |
| Standard Deviation (Population) | $7,799 | $13,901 |
Similar Demographics by Median Earnings
Demographics Similar to Albanians by Median Earnings
In terms of median earnings, the demographic groups most similar to Albanians are Immigrants from North America ($50,108, a difference of 0.020%), Immigrants from Uzbekistan ($50,151, a difference of 0.070%), Immigrants from Canada ($50,192, a difference of 0.15%), Immigrants from Hungary ($50,227, a difference of 0.22%), and Immigrants from Kazakhstan ($50,225, a difference of 0.22%).
| Demographics | Rating | Rank | Median Earnings |
| Immigrants | Southern Europe | 99.6 /100 | #81 | Exceptional $50,280 |
| Immigrants | Moldova | 99.5 /100 | #82 | Exceptional $50,274 |
| Romanians | 99.5 /100 | #83 | Exceptional $50,244 |
| Immigrants | Hungary | 99.5 /100 | #84 | Exceptional $50,227 |
| Immigrants | Kazakhstan | 99.5 /100 | #85 | Exceptional $50,225 |
| Immigrants | Canada | 99.5 /100 | #86 | Exceptional $50,192 |
| Immigrants | Uzbekistan | 99.5 /100 | #87 | Exceptional $50,151 |
| Albanians | 99.4 /100 | #88 | Exceptional $50,116 |
| Immigrants | North America | 99.4 /100 | #89 | Exceptional $50,108 |
| Italians | 99.3 /100 | #90 | Exceptional $49,915 |
| Macedonians | 99.2 /100 | #91 | Exceptional $49,893 |
| Immigrants | Argentina | 99.2 /100 | #92 | Exceptional $49,841 |
| Armenians | 99.1 /100 | #93 | Exceptional $49,804 |
| Croatians | 99.0 /100 | #94 | Exceptional $49,724 |
| Immigrants | England | 99.0 /100 | #95 | Exceptional $49,722 |
Demographics Similar to Immigrants from Bulgaria by Median Earnings
In terms of median earnings, the demographic groups most similar to Immigrants from Bulgaria are Immigrants from Romania ($51,337, a difference of 0.040%), New Zealander ($51,246, a difference of 0.14%), Greek ($51,164, a difference of 0.30%), Afghan ($51,112, a difference of 0.40%), and Immigrants from Spain ($51,092, a difference of 0.44%).
| Demographics | Rating | Rank | Median Earnings |
| Immigrants | Pakistan | 99.9 /100 | #56 | Exceptional $51,693 |
| Immigrants | Eastern Europe | 99.9 /100 | #57 | Exceptional $51,624 |
| Immigrants | Bolivia | 99.9 /100 | #58 | Exceptional $51,605 |
| Immigrants | Croatia | 99.9 /100 | #59 | Exceptional $51,581 |
| Immigrants | Serbia | 99.9 /100 | #60 | Exceptional $51,557 |
| Immigrants | Latvia | 99.9 /100 | #61 | Exceptional $51,555 |
| Immigrants | Romania | 99.9 /100 | #62 | Exceptional $51,337 |
| Immigrants | Bulgaria | 99.9 /100 | #63 | Exceptional $51,318 |
| New Zealanders | 99.9 /100 | #64 | Exceptional $51,246 |
| Greeks | 99.9 /100 | #65 | Exceptional $51,164 |
| Afghans | 99.9 /100 | #66 | Exceptional $51,112 |
| Immigrants | Spain | 99.9 /100 | #67 | Exceptional $51,092 |
| Paraguayans | 99.9 /100 | #68 | Exceptional $51,068 |
| Mongolians | 99.8 /100 | #69 | Exceptional $51,038 |
| Lithuanians | 99.8 /100 | #70 | Exceptional $50,991 |