Albanian vs Welsh Median Earnings
COMPARE
Albanian
Welsh
Median Earnings
Median Earnings Comparison
Albanians
Welsh
$50,116
MEDIAN EARNINGS
99.4/ 100
METRIC RATING
88th/ 347
METRIC RANK
$45,710
MEDIAN EARNINGS
26.6/ 100
METRIC RATING
203rd/ 347
METRIC RANK
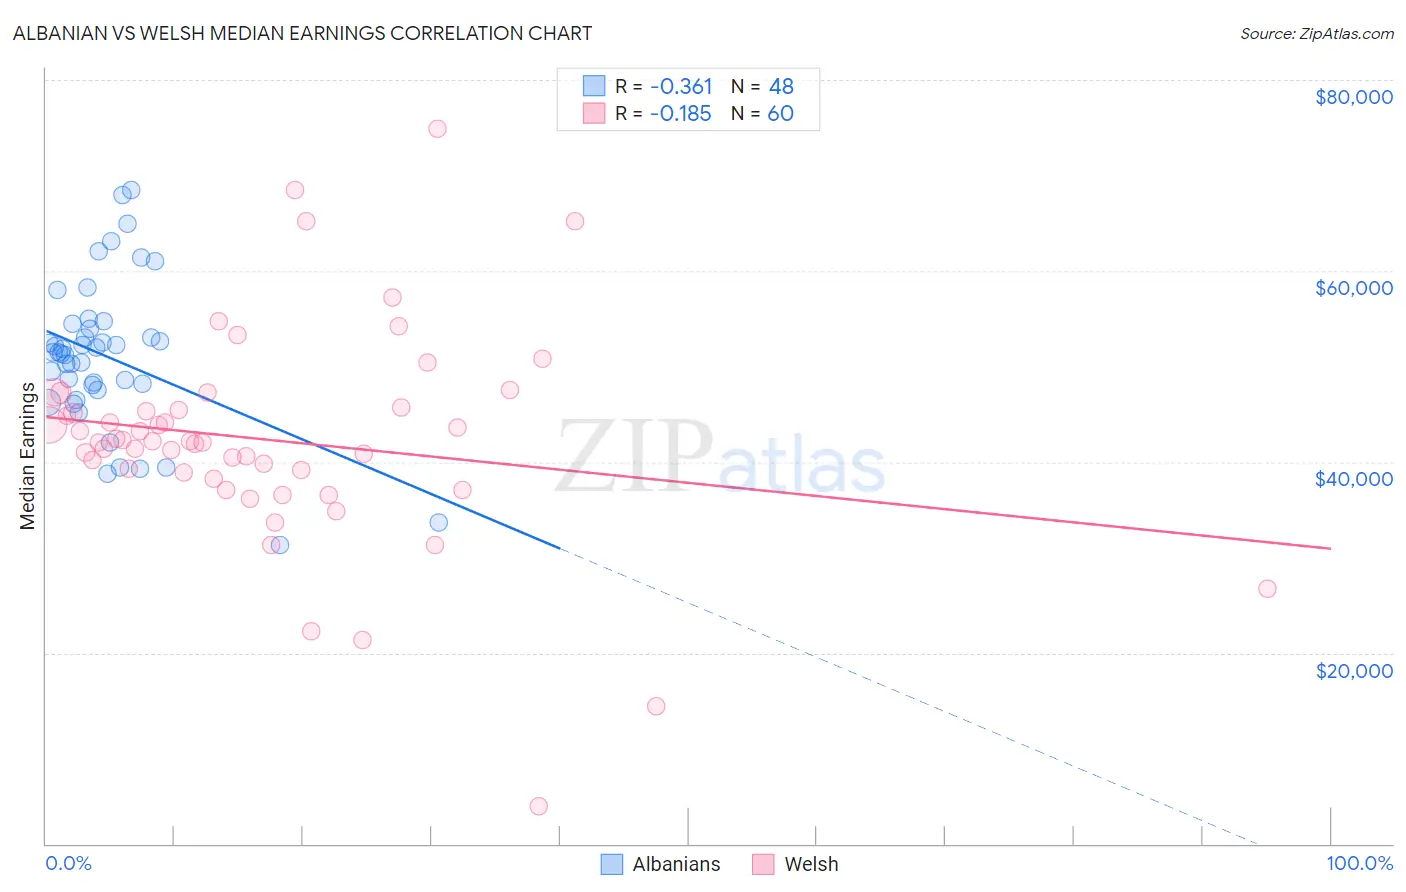
Albanian vs Welsh Median Earnings Correlation Chart
The statistical analysis conducted on geographies consisting of 193,255,601 people shows a mild negative correlation between the proportion of Albanians and median earnings in the United States with a correlation coefficient (R) of -0.361 and weighted average of $50,116. Similarly, the statistical analysis conducted on geographies consisting of 528,402,039 people shows a poor negative correlation between the proportion of Welsh and median earnings in the United States with a correlation coefficient (R) of -0.185 and weighted average of $45,710, a difference of 9.6%.
Median Earnings Correlation Summary
| Measurement | Albanian | Welsh |
| Minimum | $31,250 | $3,902 |
| Maximum | $68,474 | $74,844 |
| Range | $37,224 | $70,942 |
| Mean | $51,050 | $42,284 |
| Median | $51,491 | $42,106 |
| Interquartile 25% (IQ1) | $47,850 | $38,560 |
| Interquartile 75% (IQ3) | $54,177 | $45,605 |
| Interquartile Range (IQR) | $6,327 | $7,045 |
| Standard Deviation (Sample) | $7,882 | $11,412 |
| Standard Deviation (Population) | $7,799 | $11,316 |
Similar Demographics by Median Earnings
Demographics Similar to Albanians by Median Earnings
In terms of median earnings, the demographic groups most similar to Albanians are Immigrants from North America ($50,108, a difference of 0.020%), Immigrants from Uzbekistan ($50,151, a difference of 0.070%), Immigrants from Canada ($50,192, a difference of 0.15%), Immigrants from Hungary ($50,227, a difference of 0.22%), and Immigrants from Kazakhstan ($50,225, a difference of 0.22%).
| Demographics | Rating | Rank | Median Earnings |
| Immigrants | Southern Europe | 99.6 /100 | #81 | Exceptional $50,280 |
| Immigrants | Moldova | 99.5 /100 | #82 | Exceptional $50,274 |
| Romanians | 99.5 /100 | #83 | Exceptional $50,244 |
| Immigrants | Hungary | 99.5 /100 | #84 | Exceptional $50,227 |
| Immigrants | Kazakhstan | 99.5 /100 | #85 | Exceptional $50,225 |
| Immigrants | Canada | 99.5 /100 | #86 | Exceptional $50,192 |
| Immigrants | Uzbekistan | 99.5 /100 | #87 | Exceptional $50,151 |
| Albanians | 99.4 /100 | #88 | Exceptional $50,116 |
| Immigrants | North America | 99.4 /100 | #89 | Exceptional $50,108 |
| Italians | 99.3 /100 | #90 | Exceptional $49,915 |
| Macedonians | 99.2 /100 | #91 | Exceptional $49,893 |
| Immigrants | Argentina | 99.2 /100 | #92 | Exceptional $49,841 |
| Armenians | 99.1 /100 | #93 | Exceptional $49,804 |
| Croatians | 99.0 /100 | #94 | Exceptional $49,724 |
| Immigrants | England | 99.0 /100 | #95 | Exceptional $49,722 |
Demographics Similar to Welsh by Median Earnings
In terms of median earnings, the demographic groups most similar to Welsh are Immigrants from Trinidad and Tobago ($45,729, a difference of 0.040%), Celtic ($45,732, a difference of 0.050%), Immigrants from Uruguay ($45,682, a difference of 0.060%), Tongan ($45,665, a difference of 0.10%), and Immigrants from Ghana ($45,641, a difference of 0.15%).
| Demographics | Rating | Rank | Median Earnings |
| Yugoslavians | 30.5 /100 | #196 | Fair $45,846 |
| Barbadians | 30.5 /100 | #197 | Fair $45,846 |
| Trinidadians and Tobagonians | 29.7 /100 | #198 | Fair $45,820 |
| Immigrants | Barbados | 29.6 /100 | #199 | Fair $45,816 |
| Immigrants | Azores | 29.5 /100 | #200 | Fair $45,812 |
| Celtics | 27.2 /100 | #201 | Fair $45,732 |
| Immigrants | Trinidad and Tobago | 27.1 /100 | #202 | Fair $45,729 |
| Welsh | 26.6 /100 | #203 | Fair $45,710 |
| Immigrants | Uruguay | 25.9 /100 | #204 | Fair $45,682 |
| Tongans | 25.4 /100 | #205 | Fair $45,665 |
| Immigrants | Ghana | 24.8 /100 | #206 | Fair $45,641 |
| Immigrants | Senegal | 24.0 /100 | #207 | Fair $45,611 |
| Immigrants | Bosnia and Herzegovina | 23.7 /100 | #208 | Fair $45,600 |
| Immigrants | Thailand | 23.7 /100 | #209 | Fair $45,598 |
| Immigrants | Grenada | 23.6 /100 | #210 | Fair $45,596 |