Albanian vs Yugoslavian Median Earnings
COMPARE
Albanian
Yugoslavian
Median Earnings
Median Earnings Comparison
Albanians
Yugoslavians
$50,116
MEDIAN EARNINGS
99.4/ 100
METRIC RATING
88th/ 347
METRIC RANK
$45,846
MEDIAN EARNINGS
30.5/ 100
METRIC RATING
196th/ 347
METRIC RANK
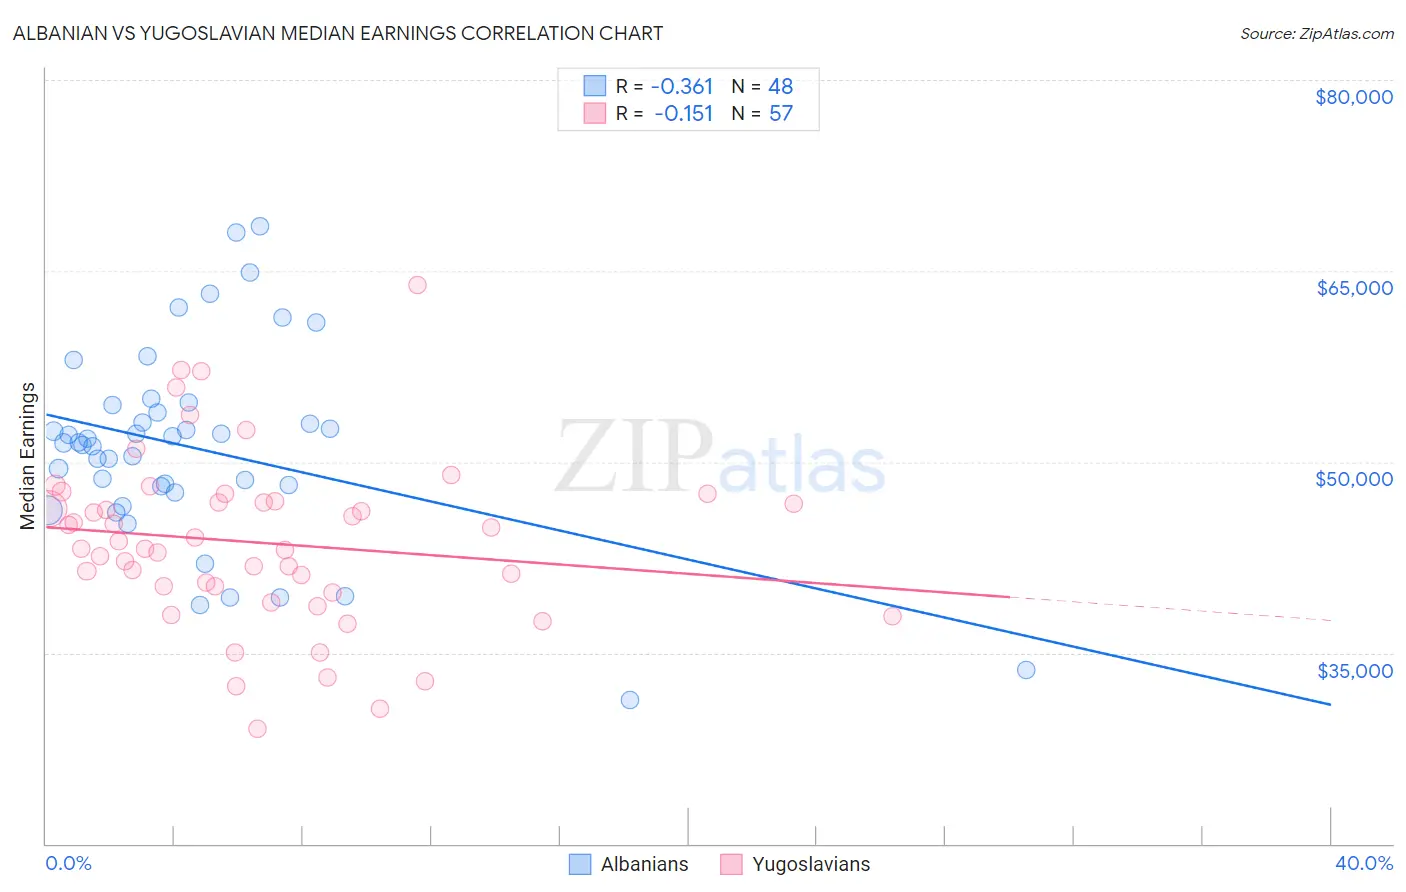
Albanian vs Yugoslavian Median Earnings Correlation Chart
The statistical analysis conducted on geographies consisting of 193,255,601 people shows a mild negative correlation between the proportion of Albanians and median earnings in the United States with a correlation coefficient (R) of -0.361 and weighted average of $50,116. Similarly, the statistical analysis conducted on geographies consisting of 285,700,192 people shows a poor negative correlation between the proportion of Yugoslavians and median earnings in the United States with a correlation coefficient (R) of -0.151 and weighted average of $45,846, a difference of 9.3%.
Median Earnings Correlation Summary
| Measurement | Albanian | Yugoslavian |
| Minimum | $31,250 | $29,039 |
| Maximum | $68,474 | $63,892 |
| Range | $37,224 | $34,853 |
| Mean | $51,050 | $43,647 |
| Median | $51,491 | $43,187 |
| Interquartile 25% (IQ1) | $47,850 | $39,984 |
| Interquartile 75% (IQ3) | $54,177 | $46,857 |
| Interquartile Range (IQR) | $6,327 | $6,873 |
| Standard Deviation (Sample) | $7,882 | $6,694 |
| Standard Deviation (Population) | $7,799 | $6,635 |
Similar Demographics by Median Earnings
Demographics Similar to Albanians by Median Earnings
In terms of median earnings, the demographic groups most similar to Albanians are Immigrants from North America ($50,108, a difference of 0.020%), Immigrants from Uzbekistan ($50,151, a difference of 0.070%), Immigrants from Canada ($50,192, a difference of 0.15%), Immigrants from Hungary ($50,227, a difference of 0.22%), and Immigrants from Kazakhstan ($50,225, a difference of 0.22%).
| Demographics | Rating | Rank | Median Earnings |
| Immigrants | Southern Europe | 99.6 /100 | #81 | Exceptional $50,280 |
| Immigrants | Moldova | 99.5 /100 | #82 | Exceptional $50,274 |
| Romanians | 99.5 /100 | #83 | Exceptional $50,244 |
| Immigrants | Hungary | 99.5 /100 | #84 | Exceptional $50,227 |
| Immigrants | Kazakhstan | 99.5 /100 | #85 | Exceptional $50,225 |
| Immigrants | Canada | 99.5 /100 | #86 | Exceptional $50,192 |
| Immigrants | Uzbekistan | 99.5 /100 | #87 | Exceptional $50,151 |
| Albanians | 99.4 /100 | #88 | Exceptional $50,116 |
| Immigrants | North America | 99.4 /100 | #89 | Exceptional $50,108 |
| Italians | 99.3 /100 | #90 | Exceptional $49,915 |
| Macedonians | 99.2 /100 | #91 | Exceptional $49,893 |
| Immigrants | Argentina | 99.2 /100 | #92 | Exceptional $49,841 |
| Armenians | 99.1 /100 | #93 | Exceptional $49,804 |
| Croatians | 99.0 /100 | #94 | Exceptional $49,724 |
| Immigrants | England | 99.0 /100 | #95 | Exceptional $49,722 |
Demographics Similar to Yugoslavians by Median Earnings
In terms of median earnings, the demographic groups most similar to Yugoslavians are Barbadian ($45,846, a difference of 0.0%), Trinidadian and Tobagonian ($45,820, a difference of 0.060%), Immigrants from Barbados ($45,816, a difference of 0.070%), Immigrants from the Azores ($45,812, a difference of 0.070%), and Immigrants from St. Vincent and the Grenadines ($45,908, a difference of 0.13%).
| Demographics | Rating | Rank | Median Earnings |
| Spaniards | 37.2 /100 | #189 | Fair $46,059 |
| French Canadians | 36.1 /100 | #190 | Fair $46,026 |
| Finns | 33.4 /100 | #191 | Fair $45,940 |
| Germans | 33.2 /100 | #192 | Fair $45,935 |
| Guamanians/Chamorros | 33.2 /100 | #193 | Fair $45,933 |
| Immigrants | Costa Rica | 33.0 /100 | #194 | Fair $45,928 |
| Immigrants | St. Vincent and the Grenadines | 32.4 /100 | #195 | Fair $45,908 |
| Yugoslavians | 30.5 /100 | #196 | Fair $45,846 |
| Barbadians | 30.5 /100 | #197 | Fair $45,846 |
| Trinidadians and Tobagonians | 29.7 /100 | #198 | Fair $45,820 |
| Immigrants | Barbados | 29.6 /100 | #199 | Fair $45,816 |
| Immigrants | Azores | 29.5 /100 | #200 | Fair $45,812 |
| Celtics | 27.2 /100 | #201 | Fair $45,732 |
| Immigrants | Trinidad and Tobago | 27.1 /100 | #202 | Fair $45,729 |
| Welsh | 26.6 /100 | #203 | Fair $45,710 |