Albanian vs Immigrants from Northern Europe Median Earnings
COMPARE
Albanian
Immigrants from Northern Europe
Median Earnings
Median Earnings Comparison
Albanians
Immigrants from Northern Europe
$50,116
MEDIAN EARNINGS
99.4/ 100
METRIC RATING
88th/ 347
METRIC RANK
$53,872
MEDIAN EARNINGS
100.0/ 100
METRIC RATING
26th/ 347
METRIC RANK
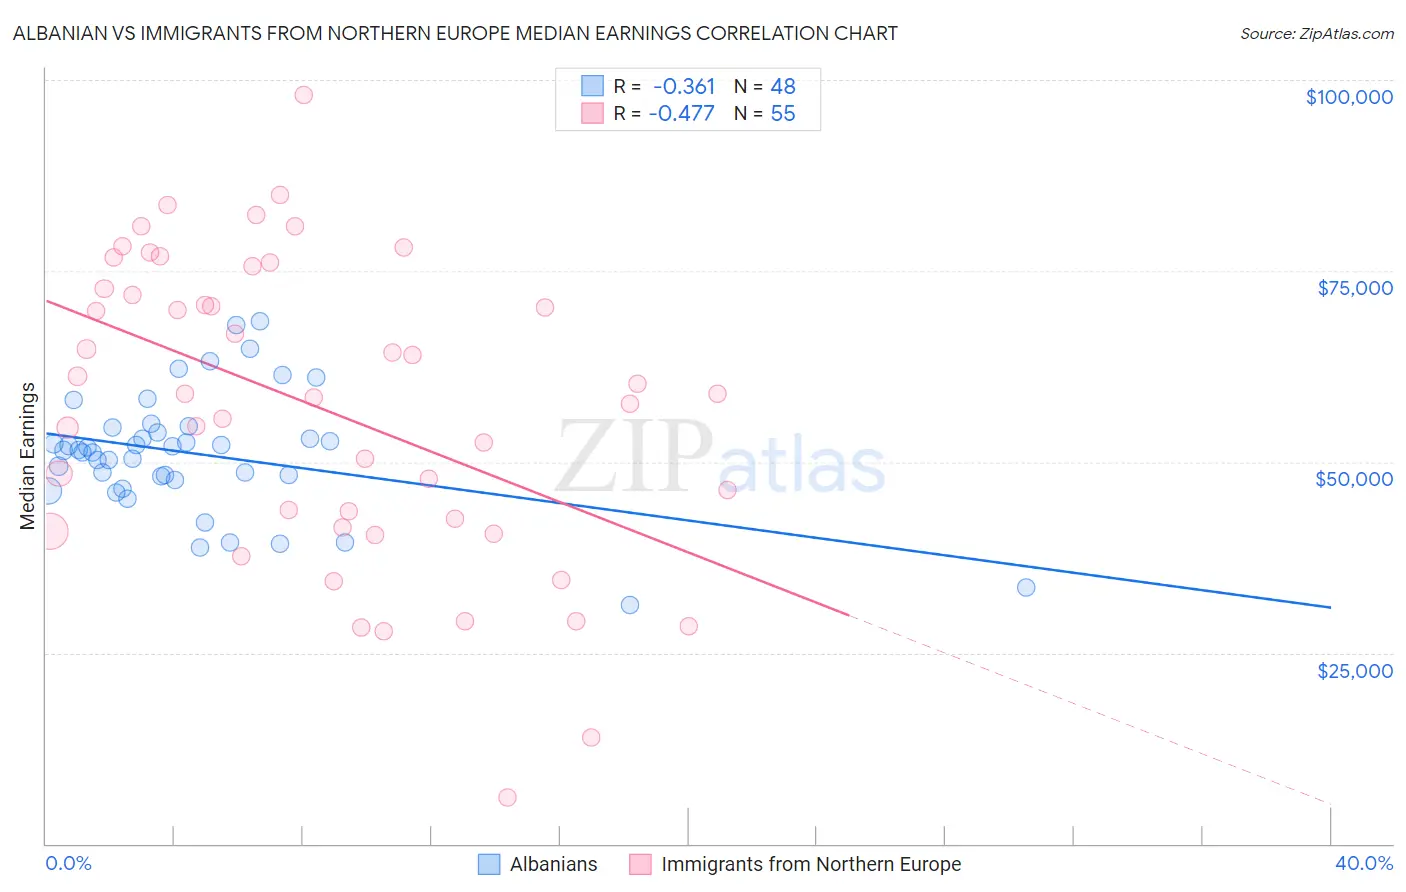
Albanian vs Immigrants from Northern Europe Median Earnings Correlation Chart
The statistical analysis conducted on geographies consisting of 193,255,601 people shows a mild negative correlation between the proportion of Albanians and median earnings in the United States with a correlation coefficient (R) of -0.361 and weighted average of $50,116. Similarly, the statistical analysis conducted on geographies consisting of 477,145,093 people shows a moderate negative correlation between the proportion of Immigrants from Northern Europe and median earnings in the United States with a correlation coefficient (R) of -0.477 and weighted average of $53,872, a difference of 7.5%.
Median Earnings Correlation Summary
| Measurement | Albanian | Immigrants from Northern Europe |
| Minimum | $31,250 | $5,997 |
| Maximum | $68,474 | $98,000 |
| Range | $37,224 | $92,003 |
| Mean | $51,050 | $56,961 |
| Median | $51,491 | $58,943 |
| Interquartile 25% (IQ1) | $47,850 | $41,349 |
| Interquartile 75% (IQ3) | $54,177 | $72,683 |
| Interquartile Range (IQR) | $6,327 | $31,335 |
| Standard Deviation (Sample) | $7,882 | $19,840 |
| Standard Deviation (Population) | $7,799 | $19,659 |
Similar Demographics by Median Earnings
Demographics Similar to Albanians by Median Earnings
In terms of median earnings, the demographic groups most similar to Albanians are Immigrants from North America ($50,108, a difference of 0.020%), Immigrants from Uzbekistan ($50,151, a difference of 0.070%), Immigrants from Canada ($50,192, a difference of 0.15%), Immigrants from Hungary ($50,227, a difference of 0.22%), and Immigrants from Kazakhstan ($50,225, a difference of 0.22%).
| Demographics | Rating | Rank | Median Earnings |
| Immigrants | Southern Europe | 99.6 /100 | #81 | Exceptional $50,280 |
| Immigrants | Moldova | 99.5 /100 | #82 | Exceptional $50,274 |
| Romanians | 99.5 /100 | #83 | Exceptional $50,244 |
| Immigrants | Hungary | 99.5 /100 | #84 | Exceptional $50,227 |
| Immigrants | Kazakhstan | 99.5 /100 | #85 | Exceptional $50,225 |
| Immigrants | Canada | 99.5 /100 | #86 | Exceptional $50,192 |
| Immigrants | Uzbekistan | 99.5 /100 | #87 | Exceptional $50,151 |
| Albanians | 99.4 /100 | #88 | Exceptional $50,116 |
| Immigrants | North America | 99.4 /100 | #89 | Exceptional $50,108 |
| Italians | 99.3 /100 | #90 | Exceptional $49,915 |
| Macedonians | 99.2 /100 | #91 | Exceptional $49,893 |
| Immigrants | Argentina | 99.2 /100 | #92 | Exceptional $49,841 |
| Armenians | 99.1 /100 | #93 | Exceptional $49,804 |
| Croatians | 99.0 /100 | #94 | Exceptional $49,724 |
| Immigrants | England | 99.0 /100 | #95 | Exceptional $49,722 |
Demographics Similar to Immigrants from Northern Europe by Median Earnings
In terms of median earnings, the demographic groups most similar to Immigrants from Northern Europe are Turkish ($53,919, a difference of 0.090%), Asian ($53,690, a difference of 0.34%), Immigrants from France ($53,490, a difference of 0.71%), Soviet Union ($54,290, a difference of 0.78%), and Immigrants from Russia ($53,457, a difference of 0.78%).
| Demographics | Rating | Rank | Median Earnings |
| Immigrants | Belgium | 100.0 /100 | #19 | Exceptional $54,679 |
| Cypriots | 100.0 /100 | #20 | Exceptional $54,589 |
| Burmese | 100.0 /100 | #21 | Exceptional $54,559 |
| Immigrants | Korea | 100.0 /100 | #22 | Exceptional $54,530 |
| Immigrants | Sweden | 100.0 /100 | #23 | Exceptional $54,478 |
| Soviet Union | 100.0 /100 | #24 | Exceptional $54,290 |
| Turks | 100.0 /100 | #25 | Exceptional $53,919 |
| Immigrants | Northern Europe | 100.0 /100 | #26 | Exceptional $53,872 |
| Asians | 100.0 /100 | #27 | Exceptional $53,690 |
| Immigrants | France | 100.0 /100 | #28 | Exceptional $53,490 |
| Immigrants | Russia | 100.0 /100 | #29 | Exceptional $53,457 |
| Cambodians | 100.0 /100 | #30 | Exceptional $53,386 |
| Russians | 100.0 /100 | #31 | Exceptional $53,334 |
| Immigrants | Asia | 100.0 /100 | #32 | Exceptional $53,310 |
| Immigrants | Greece | 100.0 /100 | #33 | Exceptional $53,282 |