Albanian vs Palestinian Median Earnings
COMPARE
Albanian
Palestinian
Median Earnings
Median Earnings Comparison
Albanians
Palestinians
$50,116
MEDIAN EARNINGS
99.4/ 100
METRIC RATING
88th/ 347
METRIC RANK
$49,209
MEDIAN EARNINGS
98.0/ 100
METRIC RATING
108th/ 347
METRIC RANK
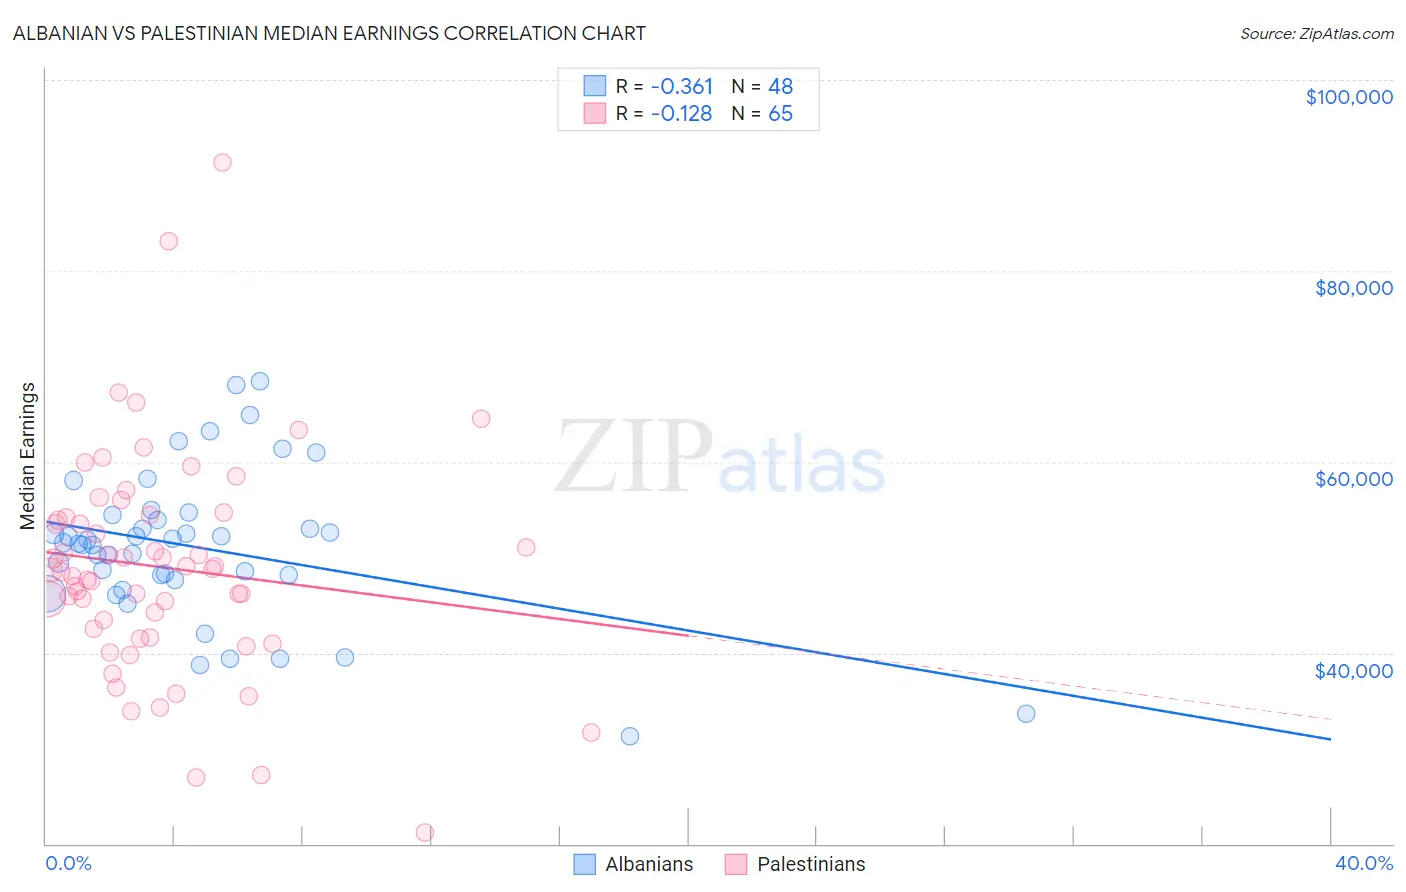
Albanian vs Palestinian Median Earnings Correlation Chart
The statistical analysis conducted on geographies consisting of 193,255,601 people shows a mild negative correlation between the proportion of Albanians and median earnings in the United States with a correlation coefficient (R) of -0.361 and weighted average of $50,116. Similarly, the statistical analysis conducted on geographies consisting of 216,457,574 people shows a poor negative correlation between the proportion of Palestinians and median earnings in the United States with a correlation coefficient (R) of -0.128 and weighted average of $49,209, a difference of 1.8%.
Median Earnings Correlation Summary
| Measurement | Albanian | Palestinian |
| Minimum | $31,250 | $21,204 |
| Maximum | $68,474 | $91,328 |
| Range | $37,224 | $70,124 |
| Mean | $51,050 | $48,950 |
| Median | $51,491 | $48,622 |
| Interquartile 25% (IQ1) | $47,850 | $42,020 |
| Interquartile 75% (IQ3) | $54,177 | $54,336 |
| Interquartile Range (IQR) | $6,327 | $12,316 |
| Standard Deviation (Sample) | $7,882 | $11,660 |
| Standard Deviation (Population) | $7,799 | $11,570 |
Demographics Similar to Albanians and Palestinians by Median Earnings
In terms of median earnings, the demographic groups most similar to Albanians are Immigrants from North America ($50,108, a difference of 0.020%), Italian ($49,915, a difference of 0.40%), Macedonian ($49,893, a difference of 0.45%), Immigrants from Argentina ($49,841, a difference of 0.55%), and Armenian ($49,804, a difference of 0.63%). Similarly, the demographic groups most similar to Palestinians are Immigrants from Morocco ($49,368, a difference of 0.32%), Immigrants from Albania ($49,377, a difference of 0.34%), Immigrants from Western Asia ($49,389, a difference of 0.37%), Immigrants from Brazil ($49,463, a difference of 0.52%), and Austrian ($49,501, a difference of 0.59%).
| Demographics | Rating | Rank | Median Earnings |
| Albanians | 99.4 /100 | #88 | Exceptional $50,116 |
| Immigrants | North America | 99.4 /100 | #89 | Exceptional $50,108 |
| Italians | 99.3 /100 | #90 | Exceptional $49,915 |
| Macedonians | 99.2 /100 | #91 | Exceptional $49,893 |
| Immigrants | Argentina | 99.2 /100 | #92 | Exceptional $49,841 |
| Armenians | 99.1 /100 | #93 | Exceptional $49,804 |
| Croatians | 99.0 /100 | #94 | Exceptional $49,724 |
| Immigrants | England | 99.0 /100 | #95 | Exceptional $49,722 |
| Immigrants | Lebanon | 99.0 /100 | #96 | Exceptional $49,682 |
| Immigrants | North Macedonia | 98.9 /100 | #97 | Exceptional $49,658 |
| Immigrants | Northern Africa | 98.9 /100 | #98 | Exceptional $49,648 |
| Immigrants | Afghanistan | 98.9 /100 | #99 | Exceptional $49,645 |
| Immigrants | Poland | 98.9 /100 | #100 | Exceptional $49,633 |
| Jordanians | 98.9 /100 | #101 | Exceptional $49,632 |
| Ethiopians | 98.8 /100 | #102 | Exceptional $49,572 |
| Austrians | 98.7 /100 | #103 | Exceptional $49,501 |
| Immigrants | Brazil | 98.6 /100 | #104 | Exceptional $49,463 |
| Immigrants | Western Asia | 98.4 /100 | #105 | Exceptional $49,389 |
| Immigrants | Albania | 98.4 /100 | #106 | Exceptional $49,377 |
| Immigrants | Morocco | 98.4 /100 | #107 | Exceptional $49,368 |
| Palestinians | 98.0 /100 | #108 | Exceptional $49,209 |