Luxembourger vs Immigrants from Guyana Wage/Income Gap
COMPARE
Luxembourger
Immigrants from Guyana
Wage/Income Gap
Wage/Income Gap Comparison
Luxembourgers
Immigrants from Guyana
27.4%
WAGE/INCOME GAP
1.9/ 100
METRIC RATING
257th/ 347
METRIC RANK
18.4%
WAGE/INCOME GAP
100.0/ 100
METRIC RATING
6th/ 347
METRIC RANK
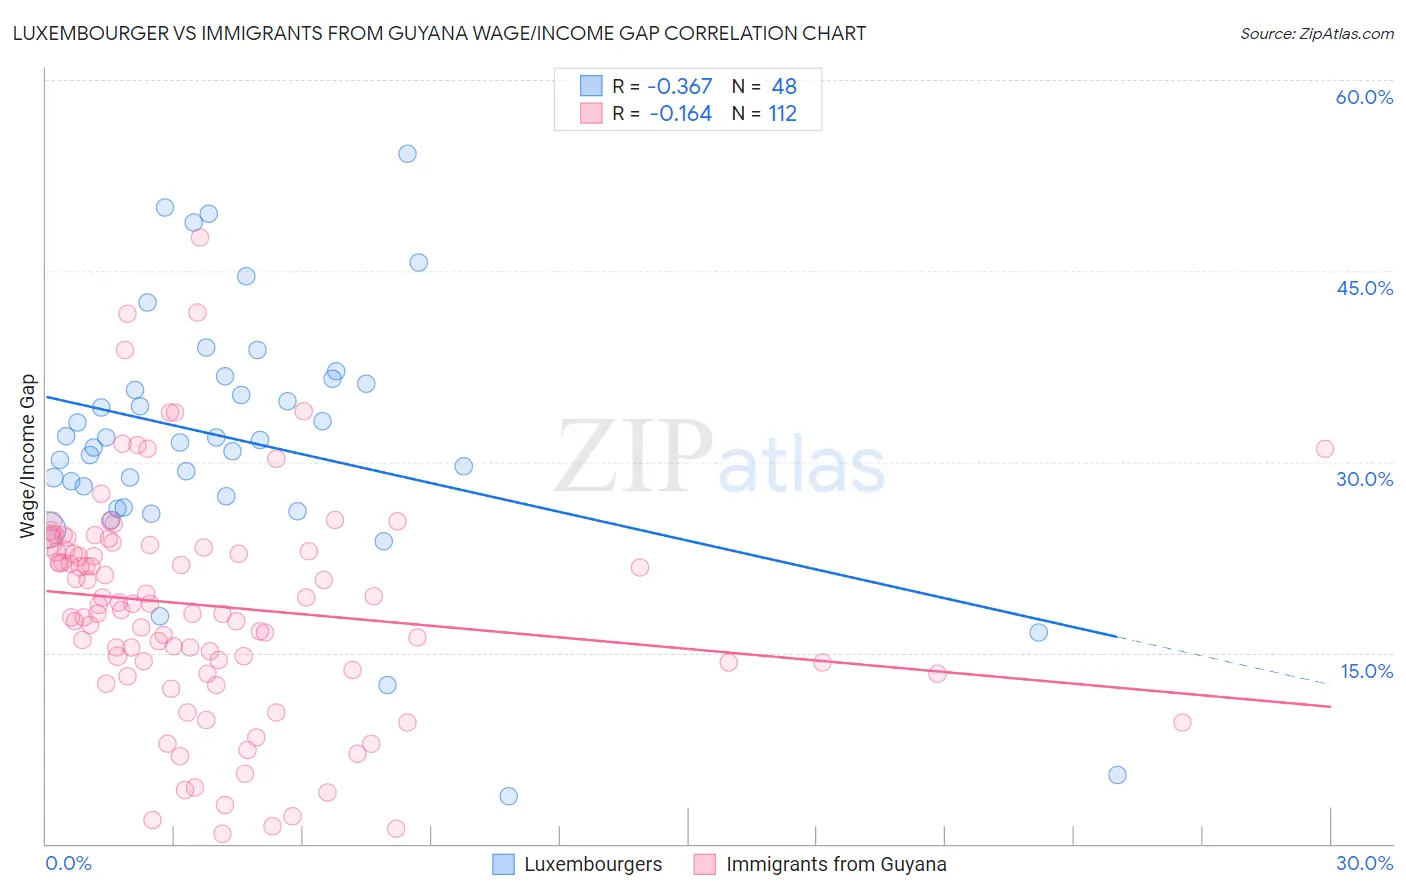
Luxembourger vs Immigrants from Guyana Wage/Income Gap Correlation Chart
The statistical analysis conducted on geographies consisting of 144,643,301 people shows a mild negative correlation between the proportion of Luxembourgers and wage/income gap percentage in the United States with a correlation coefficient (R) of -0.367 and weighted average of 27.4%. Similarly, the statistical analysis conducted on geographies consisting of 183,675,272 people shows a poor negative correlation between the proportion of Immigrants from Guyana and wage/income gap percentage in the United States with a correlation coefficient (R) of -0.164 and weighted average of 18.4%, a difference of 49.5%.
Wage/Income Gap Correlation Summary
| Measurement | Luxembourger | Immigrants from Guyana |
| Minimum | 3.7% | 0.78% |
| Maximum | 54.2% | 47.7% |
| Range | 50.5% | 46.9% |
| Mean | 31.6% | 18.7% |
| Median | 31.6% | 18.8% |
| Interquartile 25% (IQ1) | 26.9% | 13.9% |
| Interquartile 75% (IQ3) | 36.3% | 23.4% |
| Interquartile Range (IQR) | 9.5% | 9.4% |
| Standard Deviation (Sample) | 10.1% | 8.8% |
| Standard Deviation (Population) | 10.0% | 8.8% |
Similar Demographics by Wage/Income Gap
Demographics Similar to Luxembourgers by Wage/Income Gap
In terms of wage/income gap, the demographic groups most similar to Luxembourgers are Slavic (27.4%, a difference of 0.040%), Cherokee (27.4%, a difference of 0.050%), Icelander (27.5%, a difference of 0.11%), Tongan (27.5%, a difference of 0.13%), and Immigrants from France (27.4%, a difference of 0.15%).
| Demographics | Rating | Rank | Wage/Income Gap |
| Immigrants | Czechoslovakia | 2.7 /100 | #250 | Tragic 27.3% |
| Immigrants | Norway | 2.5 /100 | #251 | Tragic 27.3% |
| Ukrainians | 2.4 /100 | #252 | Tragic 27.3% |
| Portuguese | 2.2 /100 | #253 | Tragic 27.4% |
| Israelis | 2.1 /100 | #254 | Tragic 27.4% |
| Immigrants | France | 2.1 /100 | #255 | Tragic 27.4% |
| Cherokee | 1.9 /100 | #256 | Tragic 27.4% |
| Luxembourgers | 1.9 /100 | #257 | Tragic 27.4% |
| Slavs | 1.8 /100 | #258 | Tragic 27.4% |
| Icelanders | 1.8 /100 | #259 | Tragic 27.5% |
| Tongans | 1.7 /100 | #260 | Tragic 27.5% |
| Immigrants | Germany | 1.5 /100 | #261 | Tragic 27.5% |
| Immigrants | Lebanon | 1.5 /100 | #262 | Tragic 27.5% |
| Syrians | 1.4 /100 | #263 | Tragic 27.6% |
| Immigrants | Switzerland | 1.0 /100 | #264 | Tragic 27.7% |
Demographics Similar to Immigrants from Guyana by Wage/Income Gap
In terms of wage/income gap, the demographic groups most similar to Immigrants from Guyana are Guyanese (18.3%, a difference of 0.26%), British West Indian (18.0%, a difference of 1.9%), Puerto Rican (18.7%, a difference of 2.0%), Immigrants from Jamaica (18.8%, a difference of 2.6%), and Immigrants from Barbados (17.8%, a difference of 2.9%).
| Demographics | Rating | Rank | Wage/Income Gap |
| Immigrants | Grenada | 100.0 /100 | #1 | Exceptional 16.2% |
| Immigrants | St. Vincent and the Grenadines | 100.0 /100 | #2 | Exceptional 16.4% |
| Immigrants | Barbados | 100.0 /100 | #3 | Exceptional 17.8% |
| British West Indians | 100.0 /100 | #4 | Exceptional 18.0% |
| Guyanese | 100.0 /100 | #5 | Exceptional 18.3% |
| Immigrants | Guyana | 100.0 /100 | #6 | Exceptional 18.4% |
| Puerto Ricans | 100.0 /100 | #7 | Exceptional 18.7% |
| Immigrants | Jamaica | 100.0 /100 | #8 | Exceptional 18.8% |
| Barbadians | 100.0 /100 | #9 | Exceptional 19.0% |
| Crow | 100.0 /100 | #10 | Exceptional 19.1% |
| Immigrants | Haiti | 100.0 /100 | #11 | Exceptional 19.2% |
| Immigrants | West Indies | 100.0 /100 | #12 | Exceptional 19.2% |
| Trinidadians and Tobagonians | 100.0 /100 | #13 | Exceptional 19.3% |
| Immigrants | Trinidad and Tobago | 100.0 /100 | #14 | Exceptional 19.3% |
| West Indians | 100.0 /100 | #15 | Exceptional 19.6% |