Immigrants from Denmark vs Immigrants from Guyana Wage/Income Gap
COMPARE
Immigrants from Denmark
Immigrants from Guyana
Wage/Income Gap
Wage/Income Gap Comparison
Immigrants from Denmark
Immigrants from Guyana
28.5%
WAGE/INCOME GAP
0.1/ 100
METRIC RATING
307th/ 347
METRIC RANK
18.4%
WAGE/INCOME GAP
100.0/ 100
METRIC RATING
6th/ 347
METRIC RANK
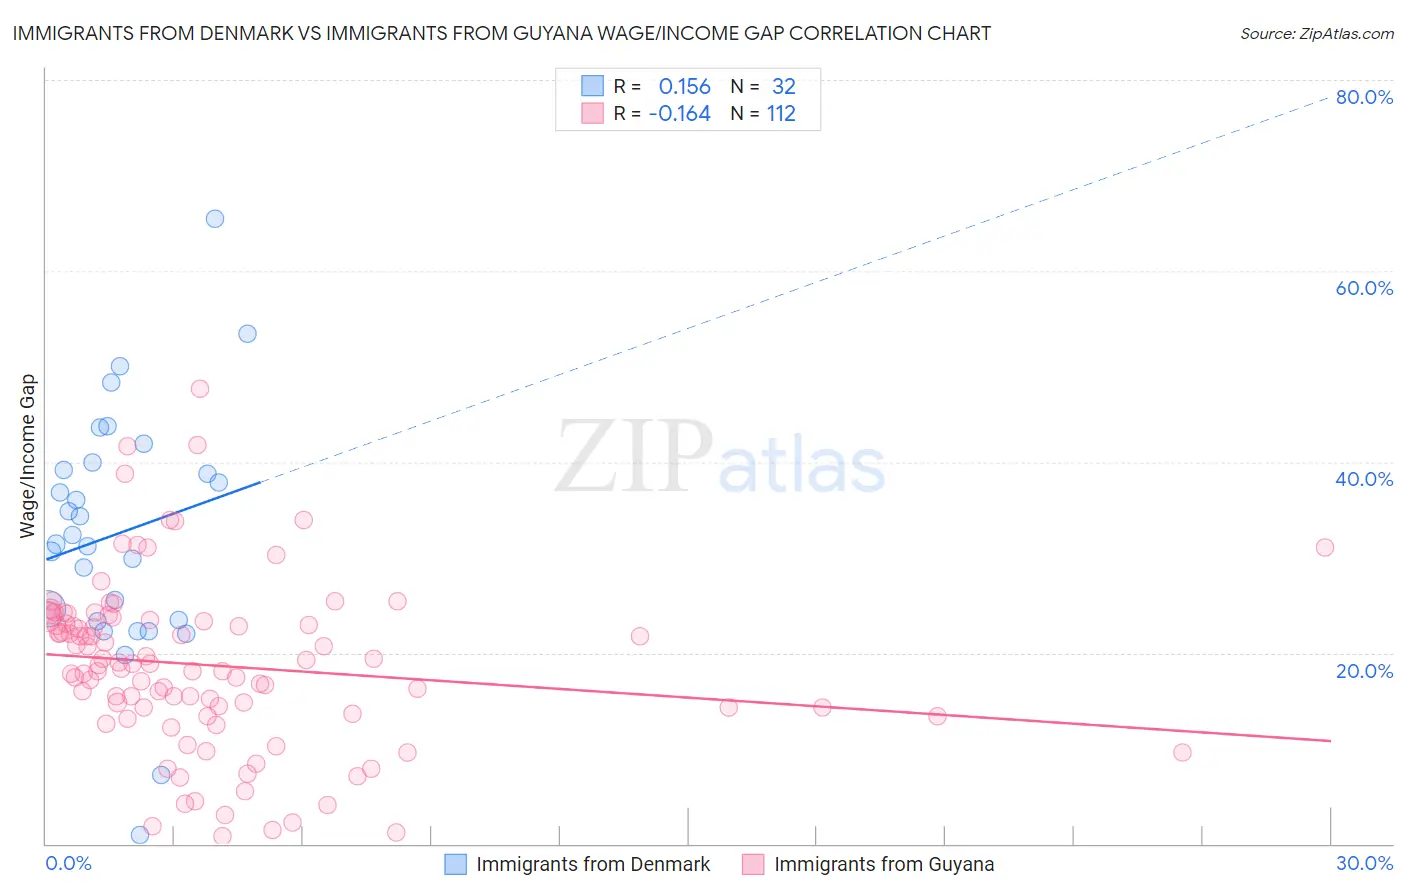
Immigrants from Denmark vs Immigrants from Guyana Wage/Income Gap Correlation Chart
The statistical analysis conducted on geographies consisting of 136,393,196 people shows a poor positive correlation between the proportion of Immigrants from Denmark and wage/income gap percentage in the United States with a correlation coefficient (R) of 0.156 and weighted average of 28.5%. Similarly, the statistical analysis conducted on geographies consisting of 183,675,272 people shows a poor negative correlation between the proportion of Immigrants from Guyana and wage/income gap percentage in the United States with a correlation coefficient (R) of -0.164 and weighted average of 18.4%, a difference of 55.4%.
Wage/Income Gap Correlation Summary
| Measurement | Immigrants from Denmark | Immigrants from Guyana |
| Minimum | 0.92% | 0.78% |
| Maximum | 65.5% | 47.7% |
| Range | 64.6% | 46.9% |
| Mean | 32.6% | 18.7% |
| Median | 31.9% | 18.8% |
| Interquartile 25% (IQ1) | 23.4% | 13.9% |
| Interquartile 75% (IQ3) | 39.5% | 23.4% |
| Interquartile Range (IQR) | 16.2% | 9.4% |
| Standard Deviation (Sample) | 12.9% | 8.8% |
| Standard Deviation (Population) | 12.7% | 8.8% |
Similar Demographics by Wage/Income Gap
Demographics Similar to Immigrants from Denmark by Wage/Income Gap
In terms of wage/income gap, the demographic groups most similar to Immigrants from Denmark are White/Caucasian (28.5%, a difference of 0.010%), Immigrants from South Africa (28.5%, a difference of 0.050%), Immigrants from Netherlands (28.5%, a difference of 0.070%), Polish (28.5%, a difference of 0.070%), and Scotch-Irish (28.5%, a difference of 0.15%).
| Demographics | Rating | Rank | Wage/Income Gap |
| Immigrants | Northern Europe | 0.2 /100 | #300 | Tragic 28.5% |
| Immigrants | Canada | 0.2 /100 | #301 | Tragic 28.5% |
| Scotch-Irish | 0.2 /100 | #302 | Tragic 28.5% |
| Irish | 0.2 /100 | #303 | Tragic 28.5% |
| Immigrants | Netherlands | 0.2 /100 | #304 | Tragic 28.5% |
| Immigrants | South Africa | 0.1 /100 | #305 | Tragic 28.5% |
| Whites/Caucasians | 0.1 /100 | #306 | Tragic 28.5% |
| Immigrants | Denmark | 0.1 /100 | #307 | Tragic 28.5% |
| Poles | 0.1 /100 | #308 | Tragic 28.5% |
| Macedonians | 0.1 /100 | #309 | Tragic 28.6% |
| Finns | 0.1 /100 | #310 | Tragic 28.6% |
| Immigrants | Lithuania | 0.1 /100 | #311 | Tragic 28.6% |
| Eastern Europeans | 0.1 /100 | #312 | Tragic 28.6% |
| French | 0.1 /100 | #313 | Tragic 28.7% |
| Immigrants | Scotland | 0.1 /100 | #314 | Tragic 28.7% |
Demographics Similar to Immigrants from Guyana by Wage/Income Gap
In terms of wage/income gap, the demographic groups most similar to Immigrants from Guyana are Guyanese (18.3%, a difference of 0.26%), British West Indian (18.0%, a difference of 1.9%), Puerto Rican (18.7%, a difference of 2.0%), Immigrants from Jamaica (18.8%, a difference of 2.6%), and Immigrants from Barbados (17.8%, a difference of 2.9%).
| Demographics | Rating | Rank | Wage/Income Gap |
| Immigrants | Grenada | 100.0 /100 | #1 | Exceptional 16.2% |
| Immigrants | St. Vincent and the Grenadines | 100.0 /100 | #2 | Exceptional 16.4% |
| Immigrants | Barbados | 100.0 /100 | #3 | Exceptional 17.8% |
| British West Indians | 100.0 /100 | #4 | Exceptional 18.0% |
| Guyanese | 100.0 /100 | #5 | Exceptional 18.3% |
| Immigrants | Guyana | 100.0 /100 | #6 | Exceptional 18.4% |
| Puerto Ricans | 100.0 /100 | #7 | Exceptional 18.7% |
| Immigrants | Jamaica | 100.0 /100 | #8 | Exceptional 18.8% |
| Barbadians | 100.0 /100 | #9 | Exceptional 19.0% |
| Crow | 100.0 /100 | #10 | Exceptional 19.1% |
| Immigrants | Haiti | 100.0 /100 | #11 | Exceptional 19.2% |
| Immigrants | West Indies | 100.0 /100 | #12 | Exceptional 19.2% |
| Trinidadians and Tobagonians | 100.0 /100 | #13 | Exceptional 19.3% |
| Immigrants | Trinidad and Tobago | 100.0 /100 | #14 | Exceptional 19.3% |
| West Indians | 100.0 /100 | #15 | Exceptional 19.6% |