Alaska Native vs Immigrants from Guyana Per Capita Income
COMPARE
Alaska Native
Immigrants from Guyana
Per Capita Income
Per Capita Income Comparison
Alaska Natives
Immigrants from Guyana
$39,558
PER CAPITA INCOME
1.0/ 100
METRIC RATING
254th/ 347
METRIC RANK
$40,742
PER CAPITA INCOME
3.6/ 100
METRIC RATING
235th/ 347
METRIC RANK
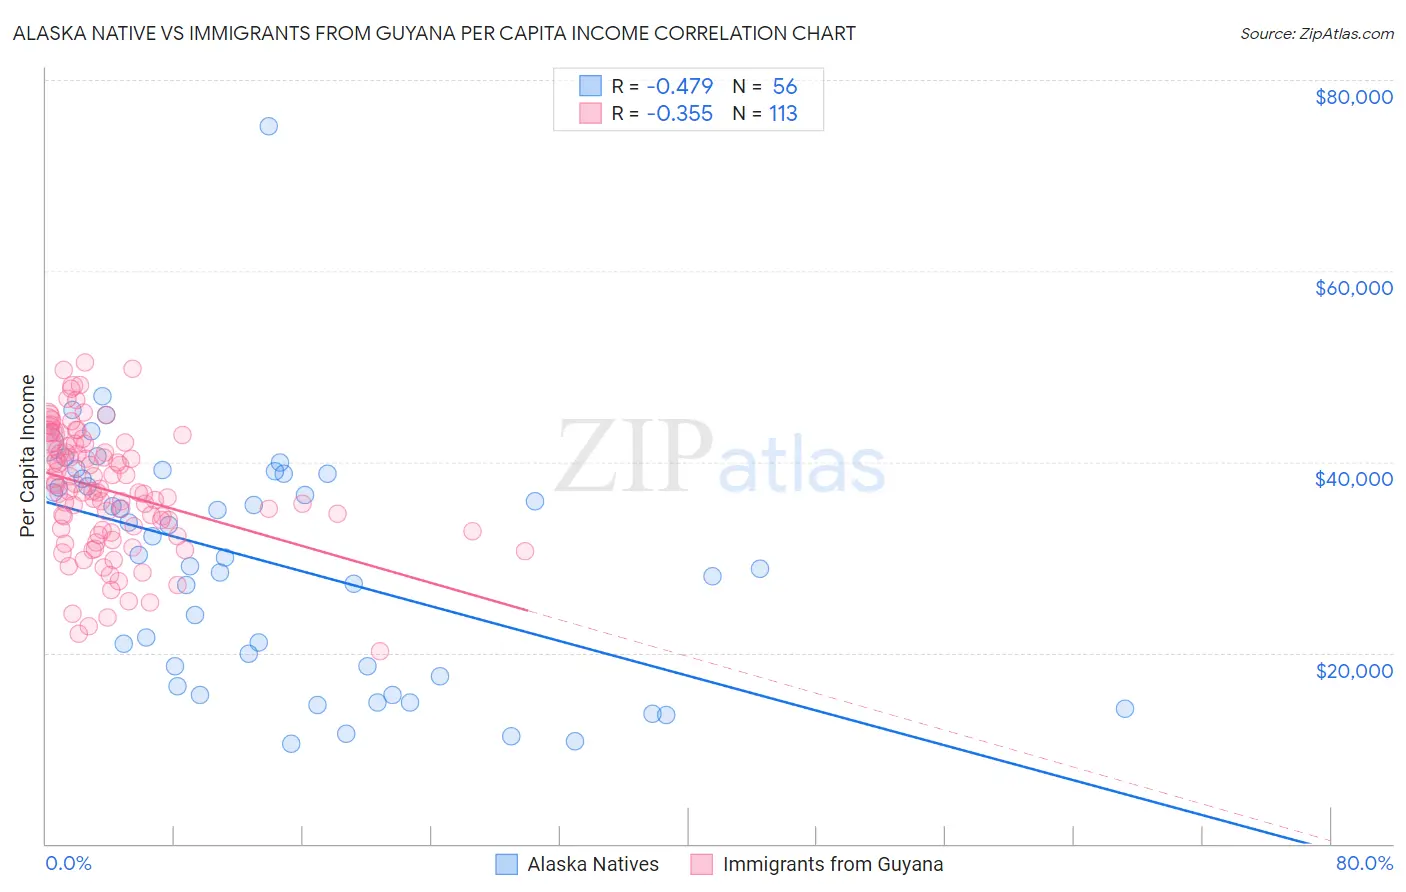
Alaska Native vs Immigrants from Guyana Per Capita Income Correlation Chart
The statistical analysis conducted on geographies consisting of 76,776,237 people shows a moderate negative correlation between the proportion of Alaska Natives and per capita income in the United States with a correlation coefficient (R) of -0.479 and weighted average of $39,558. Similarly, the statistical analysis conducted on geographies consisting of 183,742,461 people shows a mild negative correlation between the proportion of Immigrants from Guyana and per capita income in the United States with a correlation coefficient (R) of -0.355 and weighted average of $40,742, a difference of 3.0%.
Per Capita Income Correlation Summary
| Measurement | Alaska Native | Immigrants from Guyana |
| Minimum | $10,456 | $20,131 |
| Maximum | $75,144 | $50,352 |
| Range | $64,688 | $30,221 |
| Mean | $29,356 | $36,982 |
| Median | $30,080 | $36,920 |
| Interquartile 25% (IQ1) | $18,080 | $32,654 |
| Interquartile 75% (IQ3) | $38,478 | $41,898 |
| Interquartile Range (IQR) | $20,399 | $9,245 |
| Standard Deviation (Sample) | $12,502 | $6,465 |
| Standard Deviation (Population) | $12,390 | $6,436 |
Demographics Similar to Alaska Natives and Immigrants from Guyana by Per Capita Income
In terms of per capita income, the demographic groups most similar to Alaska Natives are Osage ($39,568, a difference of 0.020%), Immigrants from the Azores ($39,608, a difference of 0.13%), Immigrants from Burma/Myanmar ($39,827, a difference of 0.68%), Samoan ($39,826, a difference of 0.68%), and Japanese ($39,870, a difference of 0.79%). Similarly, the demographic groups most similar to Immigrants from Guyana are Immigrants from West Indies ($40,763, a difference of 0.050%), Nonimmigrants ($40,669, a difference of 0.18%), Immigrants from Cambodia ($40,434, a difference of 0.76%), Somali ($40,367, a difference of 0.93%), and Tsimshian ($40,344, a difference of 0.99%).
| Demographics | Rating | Rank | Per Capita Income |
| Immigrants | West Indies | 3.7 /100 | #234 | Tragic $40,763 |
| Immigrants | Guyana | 3.6 /100 | #235 | Tragic $40,742 |
| Immigrants | Nonimmigrants | 3.4 /100 | #236 | Tragic $40,669 |
| Immigrants | Cambodia | 2.6 /100 | #237 | Tragic $40,434 |
| Somalis | 2.4 /100 | #238 | Tragic $40,367 |
| Tsimshian | 2.4 /100 | #239 | Tragic $40,344 |
| Immigrants | Nigeria | 2.3 /100 | #240 | Tragic $40,339 |
| British West Indians | 2.3 /100 | #241 | Tragic $40,330 |
| Immigrants | Western Africa | 2.2 /100 | #242 | Tragic $40,294 |
| German Russians | 2.2 /100 | #243 | Tragic $40,266 |
| French American Indians | 2.1 /100 | #244 | Tragic $40,244 |
| Sub-Saharan Africans | 1.9 /100 | #245 | Tragic $40,152 |
| Cree | 1.7 /100 | #246 | Tragic $40,056 |
| Immigrants | Somalia | 1.6 /100 | #247 | Tragic $39,974 |
| Cape Verdeans | 1.5 /100 | #248 | Tragic $39,935 |
| Japanese | 1.4 /100 | #249 | Tragic $39,870 |
| Immigrants | Burma/Myanmar | 1.3 /100 | #250 | Tragic $39,827 |
| Samoans | 1.3 /100 | #251 | Tragic $39,826 |
| Immigrants | Azores | 1.0 /100 | #252 | Tragic $39,608 |
| Osage | 1.0 /100 | #253 | Tragic $39,568 |
| Alaska Natives | 1.0 /100 | #254 | Tragic $39,558 |