African vs Immigrants from Congo Median Female Earnings
COMPARE
African
Immigrants from Congo
Median Female Earnings
Median Female Earnings Comparison
Africans
Immigrants from Congo
$36,530
MEDIAN FEMALE EARNINGS
0.1/ 100
METRIC RATING
275th/ 347
METRIC RANK
$34,317
MEDIAN FEMALE EARNINGS
0.0/ 100
METRIC RATING
324th/ 347
METRIC RANK
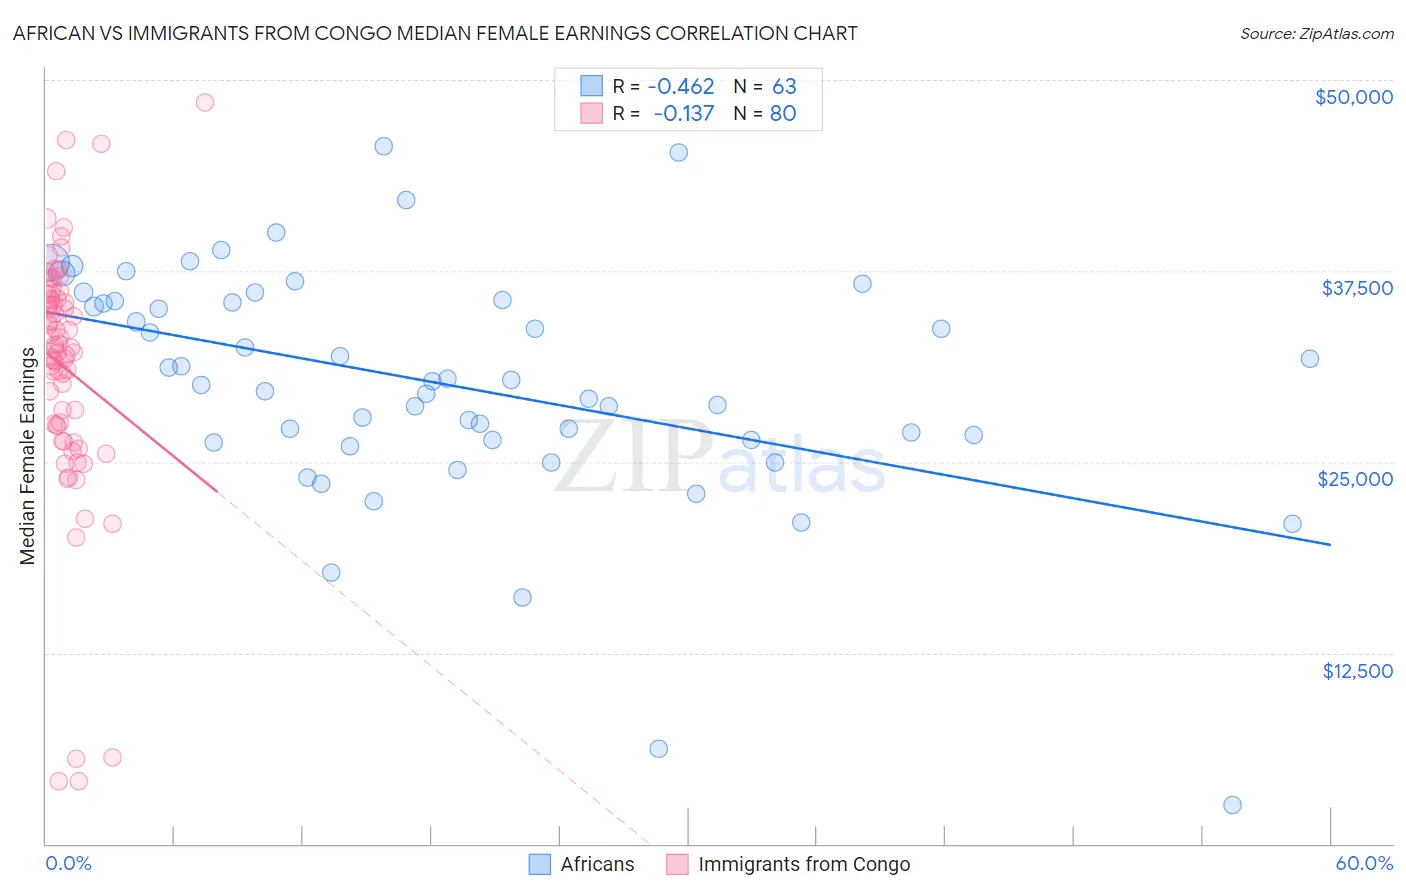
African vs Immigrants from Congo Median Female Earnings Correlation Chart
The statistical analysis conducted on geographies consisting of 469,717,352 people shows a moderate negative correlation between the proportion of Africans and median female earnings in the United States with a correlation coefficient (R) of -0.462 and weighted average of $36,530. Similarly, the statistical analysis conducted on geographies consisting of 92,121,393 people shows a poor negative correlation between the proportion of Immigrants from Congo and median female earnings in the United States with a correlation coefficient (R) of -0.137 and weighted average of $34,317, a difference of 6.5%.
Median Female Earnings Correlation Summary
| Measurement | African | Immigrants from Congo |
| Minimum | $2,499 | $4,095 |
| Maximum | $45,656 | $48,487 |
| Range | $43,157 | $44,392 |
| Mean | $30,089 | $31,171 |
| Median | $30,270 | $32,459 |
| Interquartile 25% (IQ1) | $26,393 | $27,374 |
| Interquartile 75% (IQ3) | $35,526 | $35,656 |
| Interquartile Range (IQR) | $9,133 | $8,283 |
| Standard Deviation (Sample) | $7,747 | $8,300 |
| Standard Deviation (Population) | $7,685 | $8,248 |
Similar Demographics by Median Female Earnings
Demographics Similar to Africans by Median Female Earnings
In terms of median female earnings, the demographic groups most similar to Africans are Central American ($36,492, a difference of 0.10%), Marshallese ($36,459, a difference of 0.19%), U.S. Virgin Islander ($36,424, a difference of 0.29%), Immigrants from Caribbean ($36,414, a difference of 0.32%), and Iroquois ($36,408, a difference of 0.34%).
| Demographics | Rating | Rank | Median Female Earnings |
| Cree | 0.4 /100 | #268 | Tragic $37,018 |
| Immigrants | Venezuela | 0.4 /100 | #269 | Tragic $37,003 |
| French American Indians | 0.3 /100 | #270 | Tragic $36,920 |
| Nicaraguans | 0.3 /100 | #271 | Tragic $36,904 |
| Immigrants | Dominican Republic | 0.3 /100 | #272 | Tragic $36,857 |
| Immigrants | Laos | 0.3 /100 | #273 | Tragic $36,841 |
| Immigrants | El Salvador | 0.2 /100 | #274 | Tragic $36,673 |
| Africans | 0.1 /100 | #275 | Tragic $36,530 |
| Central Americans | 0.1 /100 | #276 | Tragic $36,492 |
| Marshallese | 0.1 /100 | #277 | Tragic $36,459 |
| U.S. Virgin Islanders | 0.1 /100 | #278 | Tragic $36,424 |
| Immigrants | Caribbean | 0.1 /100 | #279 | Tragic $36,414 |
| Iroquois | 0.1 /100 | #280 | Tragic $36,408 |
| Spanish Americans | 0.1 /100 | #281 | Tragic $36,391 |
| Haitians | 0.1 /100 | #282 | Tragic $36,374 |
Demographics Similar to Immigrants from Congo by Median Female Earnings
In terms of median female earnings, the demographic groups most similar to Immigrants from Congo are Seminole ($34,385, a difference of 0.20%), Chickasaw ($34,414, a difference of 0.28%), Hispanic or Latino ($34,421, a difference of 0.31%), Dutch West Indian ($34,106, a difference of 0.62%), and Kiowa ($34,074, a difference of 0.71%).
| Demographics | Rating | Rank | Median Female Earnings |
| Potawatomi | 0.0 /100 | #317 | Tragic $34,739 |
| Immigrants | Yemen | 0.0 /100 | #318 | Tragic $34,693 |
| Shoshone | 0.0 /100 | #319 | Tragic $34,677 |
| Immigrants | Honduras | 0.0 /100 | #320 | Tragic $34,647 |
| Hispanics or Latinos | 0.0 /100 | #321 | Tragic $34,421 |
| Chickasaw | 0.0 /100 | #322 | Tragic $34,414 |
| Seminole | 0.0 /100 | #323 | Tragic $34,385 |
| Immigrants | Congo | 0.0 /100 | #324 | Tragic $34,317 |
| Dutch West Indians | 0.0 /100 | #325 | Tragic $34,106 |
| Kiowa | 0.0 /100 | #326 | Tragic $34,074 |
| Cajuns | 0.0 /100 | #327 | Tragic $34,034 |
| Immigrants | Central America | 0.0 /100 | #328 | Tragic $33,953 |
| Hopi | 0.0 /100 | #329 | Tragic $33,932 |
| Menominee | 0.0 /100 | #330 | Tragic $33,894 |
| Natives/Alaskans | 0.0 /100 | #331 | Tragic $33,806 |