African vs Immigrants from Iraq Median Female Earnings
COMPARE
African
Immigrants from Iraq
Median Female Earnings
Median Female Earnings Comparison
Africans
Immigrants from Iraq
$36,530
MEDIAN FEMALE EARNINGS
0.1/ 100
METRIC RATING
275th/ 347
METRIC RANK
$37,864
MEDIAN FEMALE EARNINGS
2.2/ 100
METRIC RATING
250th/ 347
METRIC RANK
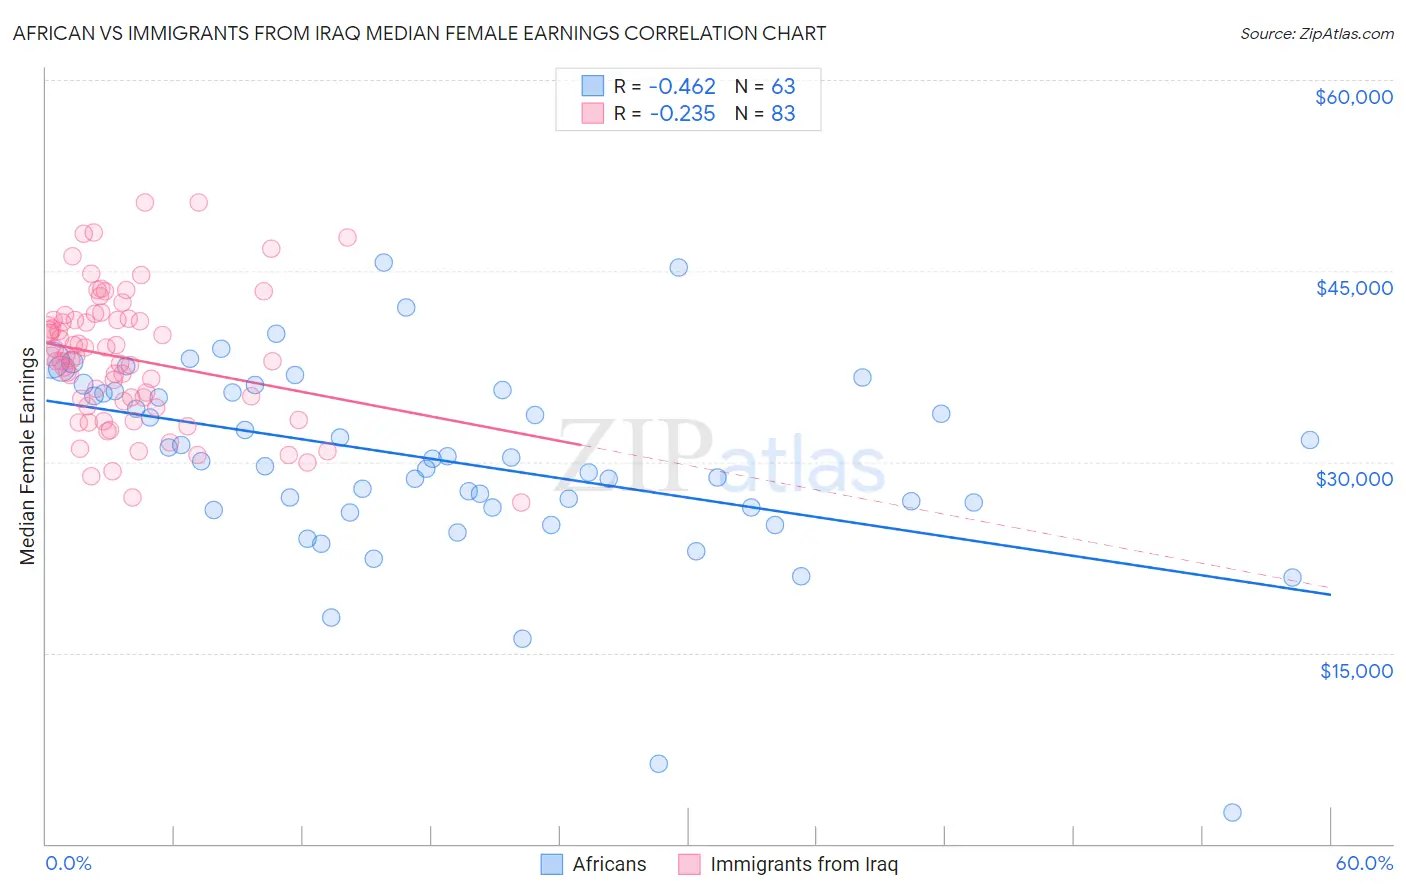
African vs Immigrants from Iraq Median Female Earnings Correlation Chart
The statistical analysis conducted on geographies consisting of 469,717,352 people shows a moderate negative correlation between the proportion of Africans and median female earnings in the United States with a correlation coefficient (R) of -0.462 and weighted average of $36,530. Similarly, the statistical analysis conducted on geographies consisting of 194,712,722 people shows a weak negative correlation between the proportion of Immigrants from Iraq and median female earnings in the United States with a correlation coefficient (R) of -0.235 and weighted average of $37,864, a difference of 3.6%.
Median Female Earnings Correlation Summary
| Measurement | African | Immigrants from Iraq |
| Minimum | $2,499 | $26,764 |
| Maximum | $45,656 | $50,383 |
| Range | $43,157 | $23,619 |
| Mean | $30,089 | $38,116 |
| Median | $30,270 | $38,258 |
| Interquartile 25% (IQ1) | $26,393 | $34,416 |
| Interquartile 75% (IQ3) | $35,526 | $41,190 |
| Interquartile Range (IQR) | $9,133 | $6,774 |
| Standard Deviation (Sample) | $7,747 | $5,230 |
| Standard Deviation (Population) | $7,685 | $5,199 |
Similar Demographics by Median Female Earnings
Demographics Similar to Africans by Median Female Earnings
In terms of median female earnings, the demographic groups most similar to Africans are Central American ($36,492, a difference of 0.10%), Marshallese ($36,459, a difference of 0.19%), U.S. Virgin Islander ($36,424, a difference of 0.29%), Immigrants from Caribbean ($36,414, a difference of 0.32%), and Iroquois ($36,408, a difference of 0.34%).
| Demographics | Rating | Rank | Median Female Earnings |
| Cree | 0.4 /100 | #268 | Tragic $37,018 |
| Immigrants | Venezuela | 0.4 /100 | #269 | Tragic $37,003 |
| French American Indians | 0.3 /100 | #270 | Tragic $36,920 |
| Nicaraguans | 0.3 /100 | #271 | Tragic $36,904 |
| Immigrants | Dominican Republic | 0.3 /100 | #272 | Tragic $36,857 |
| Immigrants | Laos | 0.3 /100 | #273 | Tragic $36,841 |
| Immigrants | El Salvador | 0.2 /100 | #274 | Tragic $36,673 |
| Africans | 0.1 /100 | #275 | Tragic $36,530 |
| Central Americans | 0.1 /100 | #276 | Tragic $36,492 |
| Marshallese | 0.1 /100 | #277 | Tragic $36,459 |
| U.S. Virgin Islanders | 0.1 /100 | #278 | Tragic $36,424 |
| Immigrants | Caribbean | 0.1 /100 | #279 | Tragic $36,414 |
| Iroquois | 0.1 /100 | #280 | Tragic $36,408 |
| Spanish Americans | 0.1 /100 | #281 | Tragic $36,391 |
| Haitians | 0.1 /100 | #282 | Tragic $36,374 |
Demographics Similar to Immigrants from Iraq by Median Female Earnings
In terms of median female earnings, the demographic groups most similar to Immigrants from Iraq are Welsh ($37,856, a difference of 0.020%), Immigrants from Dominica ($37,825, a difference of 0.10%), Alaskan Athabascan ($37,905, a difference of 0.11%), Swiss ($37,904, a difference of 0.11%), and Immigrants from Somalia ($37,914, a difference of 0.13%).
| Demographics | Rating | Rank | Median Female Earnings |
| Germans | 2.8 /100 | #243 | Tragic $37,986 |
| Immigrants | Liberia | 2.7 /100 | #244 | Tragic $37,970 |
| Immigrants | Middle Africa | 2.7 /100 | #245 | Tragic $37,965 |
| Delaware | 2.6 /100 | #246 | Tragic $37,964 |
| Immigrants | Somalia | 2.4 /100 | #247 | Tragic $37,914 |
| Alaskan Athabascans | 2.3 /100 | #248 | Tragic $37,905 |
| Swiss | 2.3 /100 | #249 | Tragic $37,904 |
| Immigrants | Iraq | 2.2 /100 | #250 | Tragic $37,864 |
| Welsh | 2.1 /100 | #251 | Tragic $37,856 |
| Immigrants | Dominica | 2.0 /100 | #252 | Tragic $37,825 |
| Danes | 1.6 /100 | #253 | Tragic $37,730 |
| Whites/Caucasians | 1.1 /100 | #254 | Tragic $37,531 |
| Colville | 1.1 /100 | #255 | Tragic $37,514 |
| Samoans | 1.0 /100 | #256 | Tragic $37,498 |
| Hawaiians | 1.0 /100 | #257 | Tragic $37,497 |