African vs Immigrants from Bangladesh Currently Married
COMPARE
African
Immigrants from Bangladesh
Currently Married
Currently Married Comparison
Africans
Immigrants from Bangladesh
41.8%
CURRENTLY MARRIED
0.0/ 100
METRIC RATING
307th/ 347
METRIC RANK
43.6%
CURRENTLY MARRIED
0.1/ 100
METRIC RATING
265th/ 347
METRIC RANK
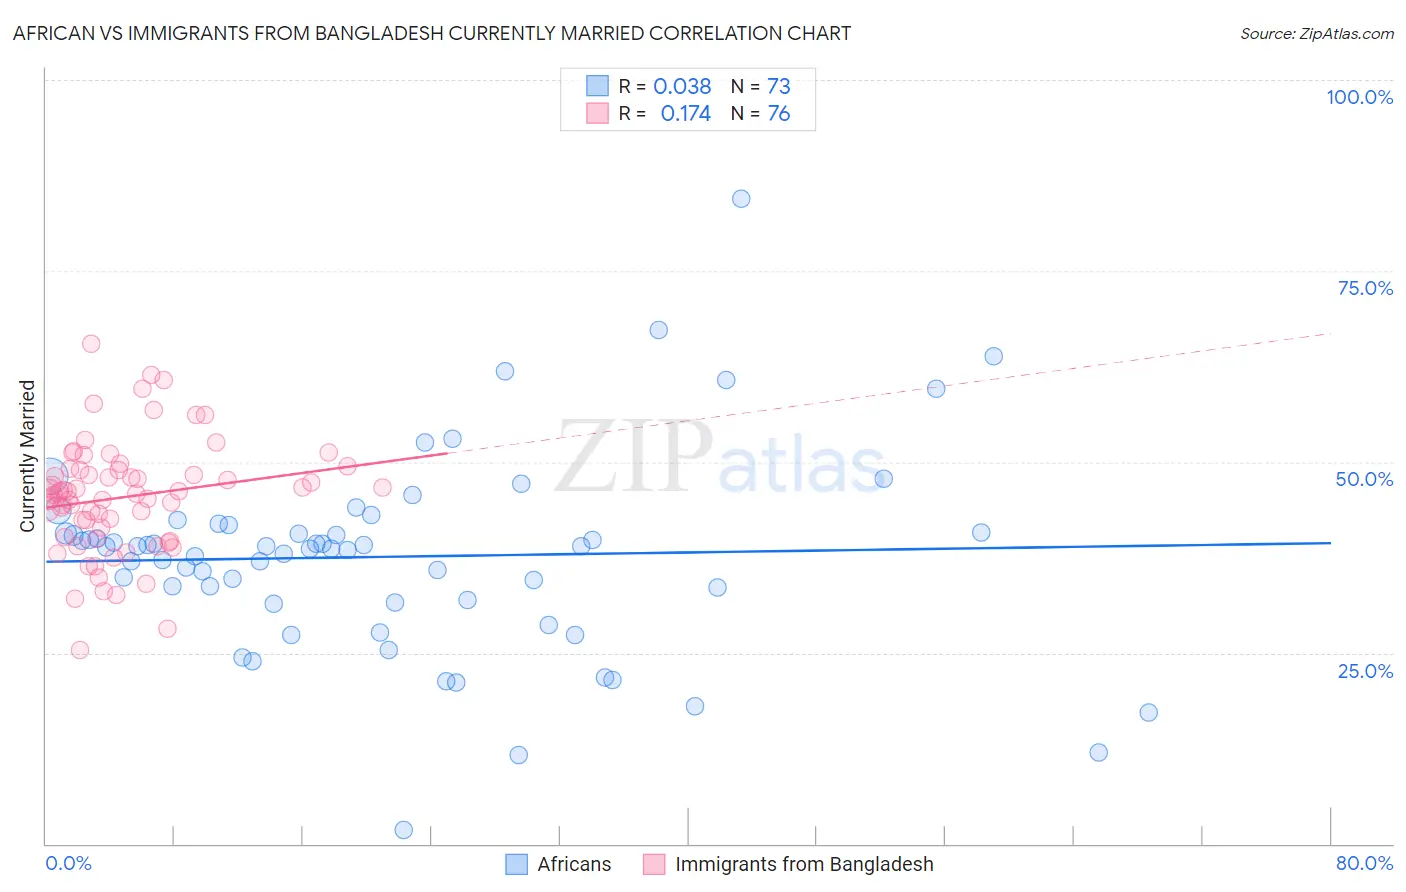
African vs Immigrants from Bangladesh Currently Married Correlation Chart
The statistical analysis conducted on geographies consisting of 470,023,481 people shows no correlation between the proportion of Africans and percentage of population currently married in the United States with a correlation coefficient (R) of 0.038 and weighted average of 41.8%. Similarly, the statistical analysis conducted on geographies consisting of 203,666,210 people shows a poor positive correlation between the proportion of Immigrants from Bangladesh and percentage of population currently married in the United States with a correlation coefficient (R) of 0.174 and weighted average of 43.6%, a difference of 4.3%.
Currently Married Correlation Summary
| Measurement | African | Immigrants from Bangladesh |
| Minimum | 1.8% | 25.3% |
| Maximum | 84.5% | 65.5% |
| Range | 82.7% | 40.2% |
| Mean | 37.6% | 45.4% |
| Median | 38.9% | 45.8% |
| Interquartile 25% (IQ1) | 31.7% | 40.7% |
| Interquartile 75% (IQ3) | 41.2% | 48.9% |
| Interquartile Range (IQR) | 9.4% | 8.2% |
| Standard Deviation (Sample) | 12.9% | 7.4% |
| Standard Deviation (Population) | 12.8% | 7.3% |
Similar Demographics by Currently Married
Demographics Similar to Africans by Currently Married
In terms of currently married, the demographic groups most similar to Africans are Immigrants from Belize (41.8%, a difference of 0.040%), Immigrants from Guyana (41.9%, a difference of 0.13%), Immigrants from Trinidad and Tobago (41.9%, a difference of 0.14%), Immigrants from Liberia (41.8%, a difference of 0.15%), and Immigrants from Bahamas (41.9%, a difference of 0.18%).
| Demographics | Rating | Rank | Currently Married |
| Belizeans | 0.0 /100 | #300 | Tragic 42.2% |
| Immigrants | Yemen | 0.0 /100 | #301 | Tragic 42.1% |
| Immigrants | Zaire | 0.0 /100 | #302 | Tragic 42.0% |
| Sioux | 0.0 /100 | #303 | Tragic 41.9% |
| Immigrants | Bahamas | 0.0 /100 | #304 | Tragic 41.9% |
| Immigrants | Trinidad and Tobago | 0.0 /100 | #305 | Tragic 41.9% |
| Immigrants | Guyana | 0.0 /100 | #306 | Tragic 41.9% |
| Africans | 0.0 /100 | #307 | Tragic 41.8% |
| Immigrants | Belize | 0.0 /100 | #308 | Tragic 41.8% |
| Immigrants | Liberia | 0.0 /100 | #309 | Tragic 41.8% |
| Guyanese | 0.0 /100 | #310 | Tragic 41.6% |
| Trinidadians and Tobagonians | 0.0 /100 | #311 | Tragic 41.5% |
| Somalis | 0.0 /100 | #312 | Tragic 41.5% |
| Jamaicans | 0.0 /100 | #313 | Tragic 41.4% |
| West Indians | 0.0 /100 | #314 | Tragic 41.3% |
Demographics Similar to Immigrants from Bangladesh by Currently Married
In terms of currently married, the demographic groups most similar to Immigrants from Bangladesh are Ecuadorian (43.6%, a difference of 0.070%), Sudanese (43.7%, a difference of 0.080%), Immigrants from Cuba (43.7%, a difference of 0.10%), Immigrants from Eritrea (43.6%, a difference of 0.10%), and Spanish American Indian (43.6%, a difference of 0.10%).
| Demographics | Rating | Rank | Currently Married |
| Ute | 0.2 /100 | #258 | Tragic 43.9% |
| Immigrants | Sierra Leone | 0.1 /100 | #259 | Tragic 43.8% |
| Immigrants | Latin America | 0.1 /100 | #260 | Tragic 43.8% |
| Immigrants | Nicaragua | 0.1 /100 | #261 | Tragic 43.7% |
| Bangladeshis | 0.1 /100 | #262 | Tragic 43.7% |
| Immigrants | Cuba | 0.1 /100 | #263 | Tragic 43.7% |
| Sudanese | 0.1 /100 | #264 | Tragic 43.7% |
| Immigrants | Bangladesh | 0.1 /100 | #265 | Tragic 43.6% |
| Ecuadorians | 0.1 /100 | #266 | Tragic 43.6% |
| Immigrants | Eritrea | 0.1 /100 | #267 | Tragic 43.6% |
| Spanish American Indians | 0.1 /100 | #268 | Tragic 43.6% |
| Immigrants | Sudan | 0.1 /100 | #269 | Tragic 43.5% |
| Salvadorans | 0.1 /100 | #270 | Tragic 43.5% |
| Bermudans | 0.1 /100 | #271 | Tragic 43.5% |
| Indonesians | 0.1 /100 | #272 | Tragic 43.5% |