African vs Immigrants from Poland Median Female Earnings
COMPARE
African
Immigrants from Poland
Median Female Earnings
Median Female Earnings Comparison
Africans
Immigrants from Poland
$36,530
MEDIAN FEMALE EARNINGS
0.1/ 100
METRIC RATING
275th/ 347
METRIC RANK
$41,630
MEDIAN FEMALE EARNINGS
98.2/ 100
METRIC RATING
102nd/ 347
METRIC RANK
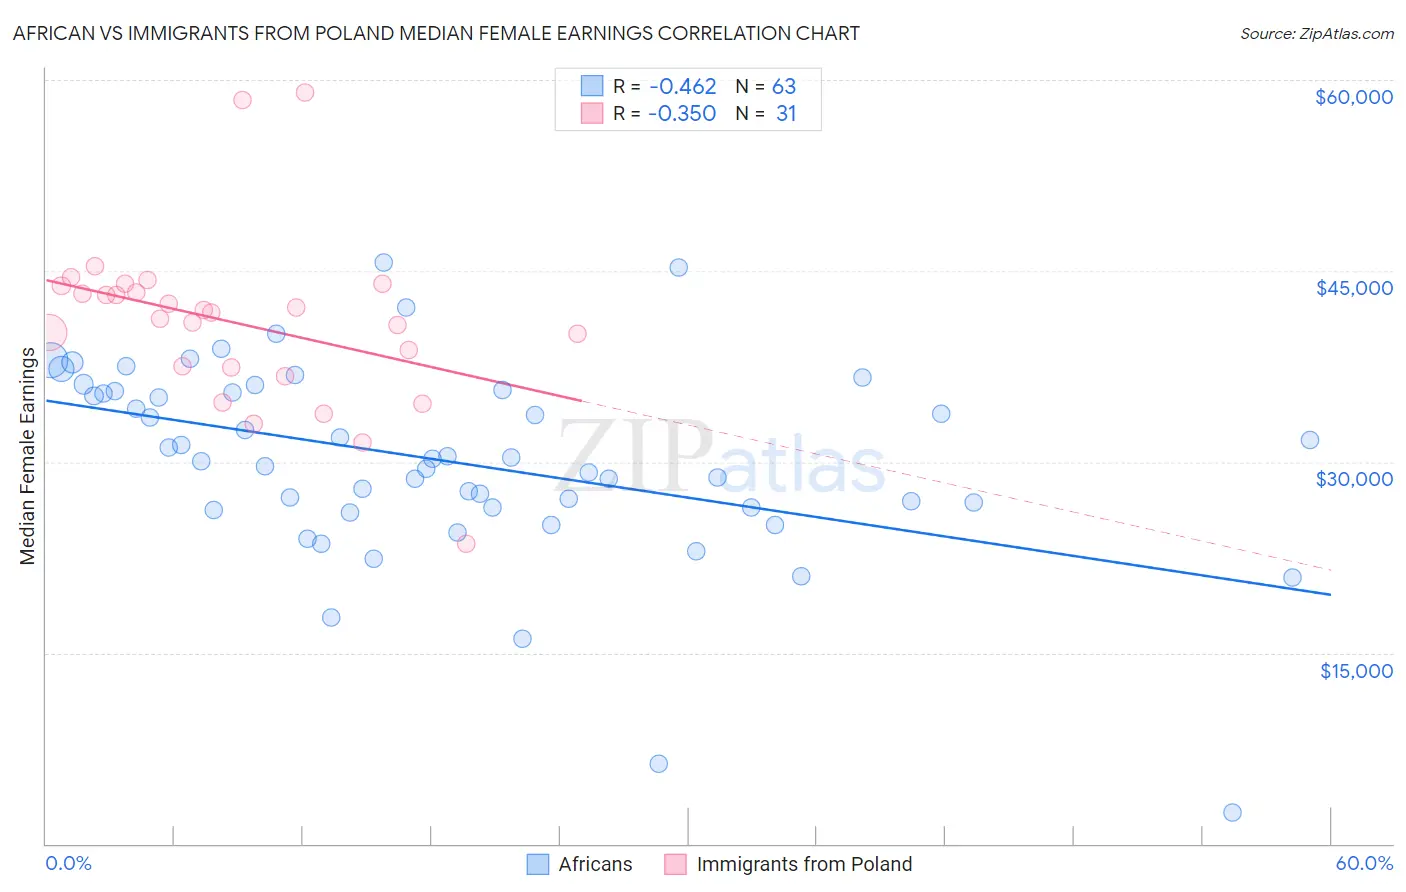
African vs Immigrants from Poland Median Female Earnings Correlation Chart
The statistical analysis conducted on geographies consisting of 469,717,352 people shows a moderate negative correlation between the proportion of Africans and median female earnings in the United States with a correlation coefficient (R) of -0.462 and weighted average of $36,530. Similarly, the statistical analysis conducted on geographies consisting of 304,768,563 people shows a mild negative correlation between the proportion of Immigrants from Poland and median female earnings in the United States with a correlation coefficient (R) of -0.350 and weighted average of $41,630, a difference of 14.0%.
Median Female Earnings Correlation Summary
| Measurement | African | Immigrants from Poland |
| Minimum | $2,499 | $23,547 |
| Maximum | $45,656 | $59,042 |
| Range | $43,157 | $35,495 |
| Mean | $30,089 | $40,933 |
| Median | $30,270 | $41,694 |
| Interquartile 25% (IQ1) | $26,393 | $37,434 |
| Interquartile 75% (IQ3) | $35,526 | $43,838 |
| Interquartile Range (IQR) | $9,133 | $6,404 |
| Standard Deviation (Sample) | $7,747 | $6,744 |
| Standard Deviation (Population) | $7,685 | $6,634 |
Similar Demographics by Median Female Earnings
Demographics Similar to Africans by Median Female Earnings
In terms of median female earnings, the demographic groups most similar to Africans are Central American ($36,492, a difference of 0.10%), Marshallese ($36,459, a difference of 0.19%), U.S. Virgin Islander ($36,424, a difference of 0.29%), Immigrants from Caribbean ($36,414, a difference of 0.32%), and Iroquois ($36,408, a difference of 0.34%).
| Demographics | Rating | Rank | Median Female Earnings |
| Cree | 0.4 /100 | #268 | Tragic $37,018 |
| Immigrants | Venezuela | 0.4 /100 | #269 | Tragic $37,003 |
| French American Indians | 0.3 /100 | #270 | Tragic $36,920 |
| Nicaraguans | 0.3 /100 | #271 | Tragic $36,904 |
| Immigrants | Dominican Republic | 0.3 /100 | #272 | Tragic $36,857 |
| Immigrants | Laos | 0.3 /100 | #273 | Tragic $36,841 |
| Immigrants | El Salvador | 0.2 /100 | #274 | Tragic $36,673 |
| Africans | 0.1 /100 | #275 | Tragic $36,530 |
| Central Americans | 0.1 /100 | #276 | Tragic $36,492 |
| Marshallese | 0.1 /100 | #277 | Tragic $36,459 |
| U.S. Virgin Islanders | 0.1 /100 | #278 | Tragic $36,424 |
| Immigrants | Caribbean | 0.1 /100 | #279 | Tragic $36,414 |
| Iroquois | 0.1 /100 | #280 | Tragic $36,408 |
| Spanish Americans | 0.1 /100 | #281 | Tragic $36,391 |
| Haitians | 0.1 /100 | #282 | Tragic $36,374 |
Demographics Similar to Immigrants from Poland by Median Female Earnings
In terms of median female earnings, the demographic groups most similar to Immigrants from Poland are Immigrants from Fiji ($41,656, a difference of 0.060%), Romanian ($41,663, a difference of 0.080%), Immigrants from Barbados ($41,685, a difference of 0.13%), Immigrants from Argentina ($41,554, a difference of 0.18%), and Immigrants from Zimbabwe ($41,527, a difference of 0.25%).
| Demographics | Rating | Rank | Median Female Earnings |
| Immigrants | Netherlands | 98.9 /100 | #95 | Exceptional $41,870 |
| South Africans | 98.8 /100 | #96 | Exceptional $41,825 |
| Immigrants | Hungary | 98.8 /100 | #97 | Exceptional $41,820 |
| Immigrants | Scotland | 98.7 /100 | #98 | Exceptional $41,771 |
| Immigrants | Barbados | 98.4 /100 | #99 | Exceptional $41,685 |
| Romanians | 98.3 /100 | #100 | Exceptional $41,663 |
| Immigrants | Fiji | 98.3 /100 | #101 | Exceptional $41,656 |
| Immigrants | Poland | 98.2 /100 | #102 | Exceptional $41,630 |
| Immigrants | Argentina | 97.9 /100 | #103 | Exceptional $41,554 |
| Immigrants | Zimbabwe | 97.8 /100 | #104 | Exceptional $41,527 |
| Italians | 97.7 /100 | #105 | Exceptional $41,505 |
| Immigrants | Eritrea | 97.6 /100 | #106 | Exceptional $41,485 |
| Palestinians | 97.6 /100 | #107 | Exceptional $41,484 |
| Jordanians | 97.5 /100 | #108 | Exceptional $41,464 |
| Chinese | 97.5 /100 | #109 | Exceptional $41,461 |