African vs Belizean Median Female Earnings
COMPARE
African
Belizean
Median Female Earnings
Median Female Earnings Comparison
Africans
Belizeans
$36,530
MEDIAN FEMALE EARNINGS
0.1/ 100
METRIC RATING
275th/ 347
METRIC RANK
$37,429
MEDIAN FEMALE EARNINGS
0.9/ 100
METRIC RATING
258th/ 347
METRIC RANK
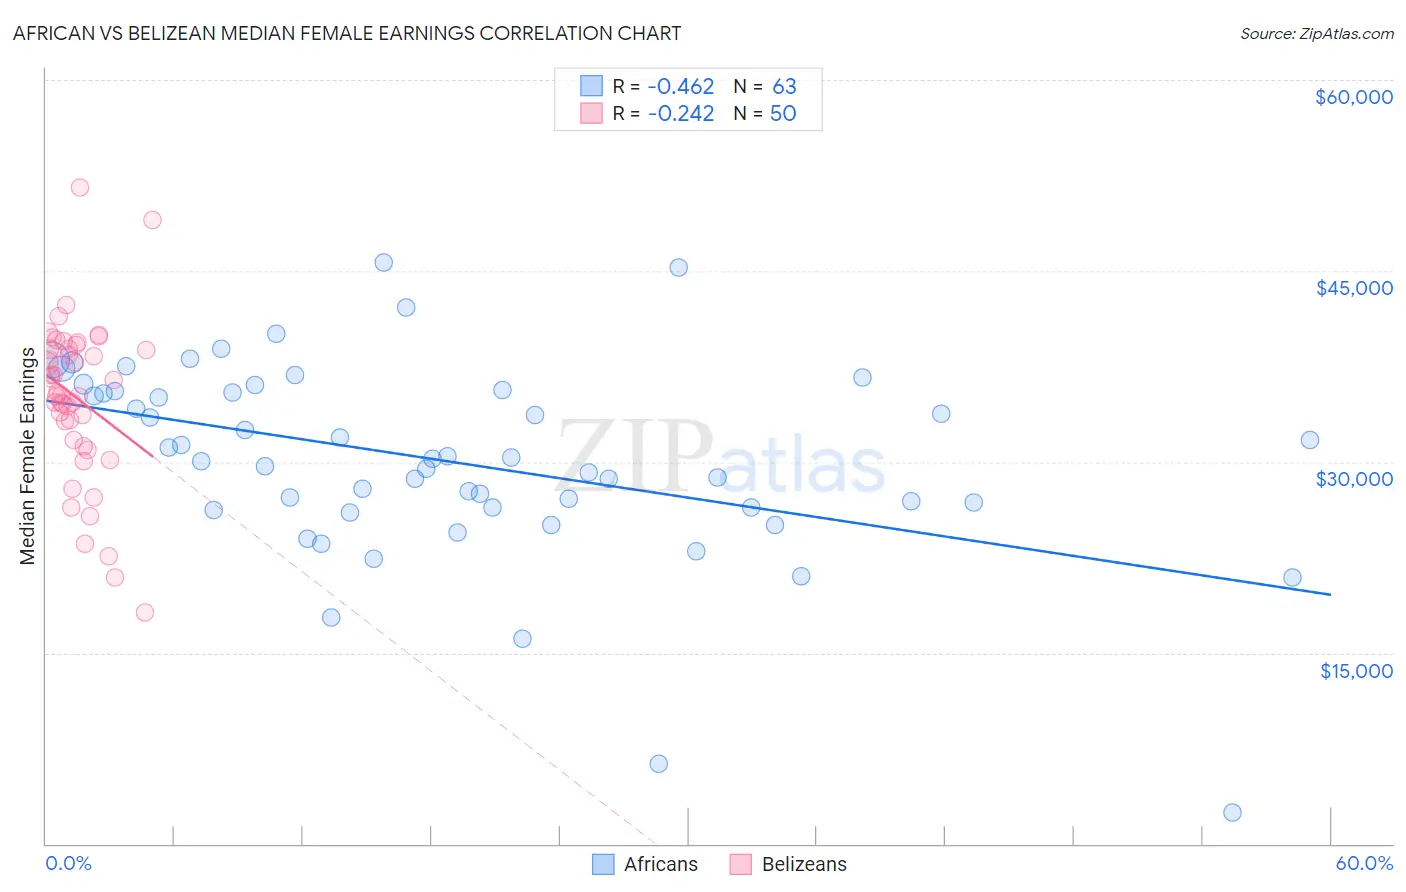
African vs Belizean Median Female Earnings Correlation Chart
The statistical analysis conducted on geographies consisting of 469,717,352 people shows a moderate negative correlation between the proportion of Africans and median female earnings in the United States with a correlation coefficient (R) of -0.462 and weighted average of $36,530. Similarly, the statistical analysis conducted on geographies consisting of 144,203,712 people shows a weak negative correlation between the proportion of Belizeans and median female earnings in the United States with a correlation coefficient (R) of -0.242 and weighted average of $37,429, a difference of 2.5%.
Median Female Earnings Correlation Summary
| Measurement | African | Belizean |
| Minimum | $2,499 | $18,201 |
| Maximum | $45,656 | $51,565 |
| Range | $43,157 | $33,364 |
| Mean | $30,089 | $34,988 |
| Median | $30,270 | $35,337 |
| Interquartile 25% (IQ1) | $26,393 | $31,707 |
| Interquartile 75% (IQ3) | $35,526 | $38,920 |
| Interquartile Range (IQR) | $9,133 | $7,213 |
| Standard Deviation (Sample) | $7,747 | $6,353 |
| Standard Deviation (Population) | $7,685 | $6,289 |
Demographics Similar to Africans and Belizeans by Median Female Earnings
In terms of median female earnings, the demographic groups most similar to Africans are Central American ($36,492, a difference of 0.10%), Immigrants from El Salvador ($36,673, a difference of 0.39%), Immigrants from Laos ($36,841, a difference of 0.85%), Immigrants from Dominican Republic ($36,857, a difference of 0.90%), and Nicaraguan ($36,904, a difference of 1.0%). Similarly, the demographic groups most similar to Belizeans are Scotch-Irish ($37,383, a difference of 0.12%), Hawaiian ($37,497, a difference of 0.18%), Samoan ($37,498, a difference of 0.19%), Dutch ($37,339, a difference of 0.24%), and Malaysian ($37,298, a difference of 0.35%).
| Demographics | Rating | Rank | Median Female Earnings |
| Samoans | 1.0 /100 | #256 | Tragic $37,498 |
| Hawaiians | 1.0 /100 | #257 | Tragic $37,497 |
| Belizeans | 0.9 /100 | #258 | Tragic $37,429 |
| Scotch-Irish | 0.8 /100 | #259 | Tragic $37,383 |
| Dutch | 0.7 /100 | #260 | Tragic $37,339 |
| Malaysians | 0.7 /100 | #261 | Tragic $37,298 |
| Venezuelans | 0.7 /100 | #262 | Tragic $37,282 |
| German Russians | 0.5 /100 | #263 | Tragic $37,105 |
| Salvadorans | 0.4 /100 | #264 | Tragic $37,083 |
| Immigrants | Belize | 0.4 /100 | #265 | Tragic $37,056 |
| Dominicans | 0.4 /100 | #266 | Tragic $37,046 |
| Immigrants | Nonimmigrants | 0.4 /100 | #267 | Tragic $37,024 |
| Cree | 0.4 /100 | #268 | Tragic $37,018 |
| Immigrants | Venezuela | 0.4 /100 | #269 | Tragic $37,003 |
| French American Indians | 0.3 /100 | #270 | Tragic $36,920 |
| Nicaraguans | 0.3 /100 | #271 | Tragic $36,904 |
| Immigrants | Dominican Republic | 0.3 /100 | #272 | Tragic $36,857 |
| Immigrants | Laos | 0.3 /100 | #273 | Tragic $36,841 |
| Immigrants | El Salvador | 0.2 /100 | #274 | Tragic $36,673 |
| Africans | 0.1 /100 | #275 | Tragic $36,530 |
| Central Americans | 0.1 /100 | #276 | Tragic $36,492 |