African vs Eastern European Median Female Earnings
COMPARE
African
Eastern European
Median Female Earnings
Median Female Earnings Comparison
Africans
Eastern Europeans
$36,530
MEDIAN FEMALE EARNINGS
0.1/ 100
METRIC RATING
275th/ 347
METRIC RANK
$45,385
MEDIAN FEMALE EARNINGS
100.0/ 100
METRIC RATING
19th/ 347
METRIC RANK
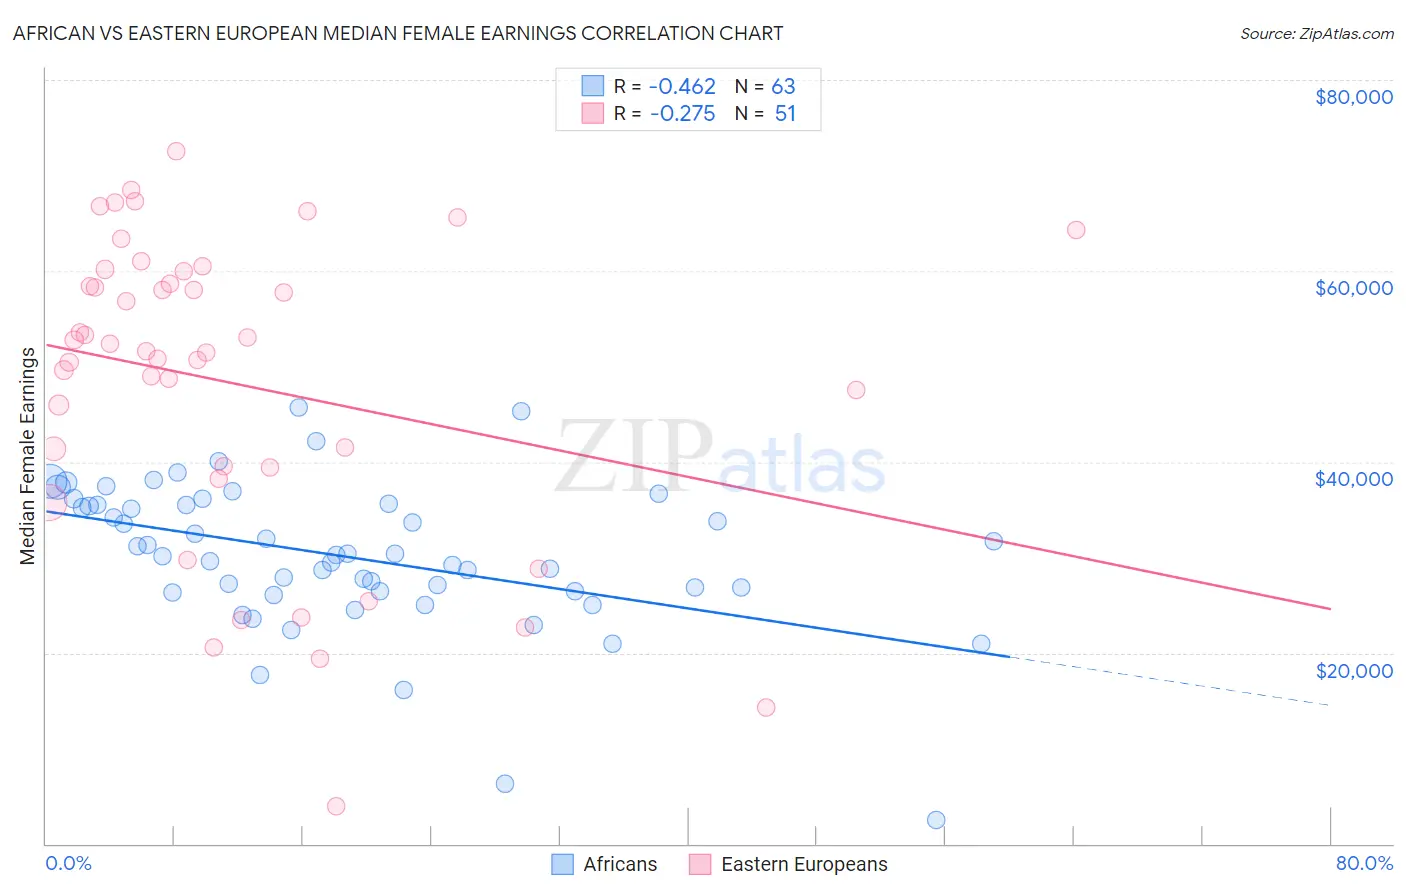
African vs Eastern European Median Female Earnings Correlation Chart
The statistical analysis conducted on geographies consisting of 469,717,352 people shows a moderate negative correlation between the proportion of Africans and median female earnings in the United States with a correlation coefficient (R) of -0.462 and weighted average of $36,530. Similarly, the statistical analysis conducted on geographies consisting of 460,854,647 people shows a weak negative correlation between the proportion of Eastern Europeans and median female earnings in the United States with a correlation coefficient (R) of -0.275 and weighted average of $45,385, a difference of 24.2%.
Median Female Earnings Correlation Summary
| Measurement | African | Eastern European |
| Minimum | $2,499 | $3,984 |
| Maximum | $45,656 | $72,541 |
| Range | $43,157 | $68,557 |
| Mean | $30,089 | $48,179 |
| Median | $30,270 | $51,543 |
| Interquartile 25% (IQ1) | $26,393 | $39,388 |
| Interquartile 75% (IQ3) | $35,526 | $59,979 |
| Interquartile Range (IQR) | $9,133 | $20,591 |
| Standard Deviation (Sample) | $7,747 | $16,076 |
| Standard Deviation (Population) | $7,685 | $15,918 |
Similar Demographics by Median Female Earnings
Demographics Similar to Africans by Median Female Earnings
In terms of median female earnings, the demographic groups most similar to Africans are Central American ($36,492, a difference of 0.10%), Marshallese ($36,459, a difference of 0.19%), U.S. Virgin Islander ($36,424, a difference of 0.29%), Immigrants from Caribbean ($36,414, a difference of 0.32%), and Iroquois ($36,408, a difference of 0.34%).
| Demographics | Rating | Rank | Median Female Earnings |
| Cree | 0.4 /100 | #268 | Tragic $37,018 |
| Immigrants | Venezuela | 0.4 /100 | #269 | Tragic $37,003 |
| French American Indians | 0.3 /100 | #270 | Tragic $36,920 |
| Nicaraguans | 0.3 /100 | #271 | Tragic $36,904 |
| Immigrants | Dominican Republic | 0.3 /100 | #272 | Tragic $36,857 |
| Immigrants | Laos | 0.3 /100 | #273 | Tragic $36,841 |
| Immigrants | El Salvador | 0.2 /100 | #274 | Tragic $36,673 |
| Africans | 0.1 /100 | #275 | Tragic $36,530 |
| Central Americans | 0.1 /100 | #276 | Tragic $36,492 |
| Marshallese | 0.1 /100 | #277 | Tragic $36,459 |
| U.S. Virgin Islanders | 0.1 /100 | #278 | Tragic $36,424 |
| Immigrants | Caribbean | 0.1 /100 | #279 | Tragic $36,414 |
| Iroquois | 0.1 /100 | #280 | Tragic $36,408 |
| Spanish Americans | 0.1 /100 | #281 | Tragic $36,391 |
| Haitians | 0.1 /100 | #282 | Tragic $36,374 |
Demographics Similar to Eastern Europeans by Median Female Earnings
In terms of median female earnings, the demographic groups most similar to Eastern Europeans are Immigrants from Japan ($45,323, a difference of 0.14%), Cypriot ($45,570, a difference of 0.41%), Cambodian ($45,014, a difference of 0.82%), Immigrants from Greece ($44,976, a difference of 0.91%), and Burmese ($44,911, a difference of 1.1%).
| Demographics | Rating | Rank | Median Female Earnings |
| Immigrants | Israel | 100.0 /100 | #12 | Exceptional $46,902 |
| Immigrants | Australia | 100.0 /100 | #13 | Exceptional $46,573 |
| Soviet Union | 100.0 /100 | #14 | Exceptional $46,556 |
| Immigrants | Eastern Asia | 100.0 /100 | #15 | Exceptional $46,502 |
| Indians (Asian) | 100.0 /100 | #16 | Exceptional $46,481 |
| Immigrants | South Central Asia | 100.0 /100 | #17 | Exceptional $46,324 |
| Cypriots | 100.0 /100 | #18 | Exceptional $45,570 |
| Eastern Europeans | 100.0 /100 | #19 | Exceptional $45,385 |
| Immigrants | Japan | 100.0 /100 | #20 | Exceptional $45,323 |
| Cambodians | 100.0 /100 | #21 | Exceptional $45,014 |
| Immigrants | Greece | 100.0 /100 | #22 | Exceptional $44,976 |
| Burmese | 100.0 /100 | #23 | Exceptional $44,911 |
| Immigrants | Korea | 100.0 /100 | #24 | Exceptional $44,847 |
| Immigrants | Sweden | 100.0 /100 | #25 | Exceptional $44,774 |
| Immigrants | Belarus | 100.0 /100 | #26 | Exceptional $44,757 |