African vs Arab Median Female Earnings
COMPARE
African
Arab
Median Female Earnings
Median Female Earnings Comparison
Africans
Arabs
$36,530
MEDIAN FEMALE EARNINGS
0.1/ 100
METRIC RATING
275th/ 347
METRIC RANK
$40,718
MEDIAN FEMALE EARNINGS
89.3/ 100
METRIC RATING
134th/ 347
METRIC RANK
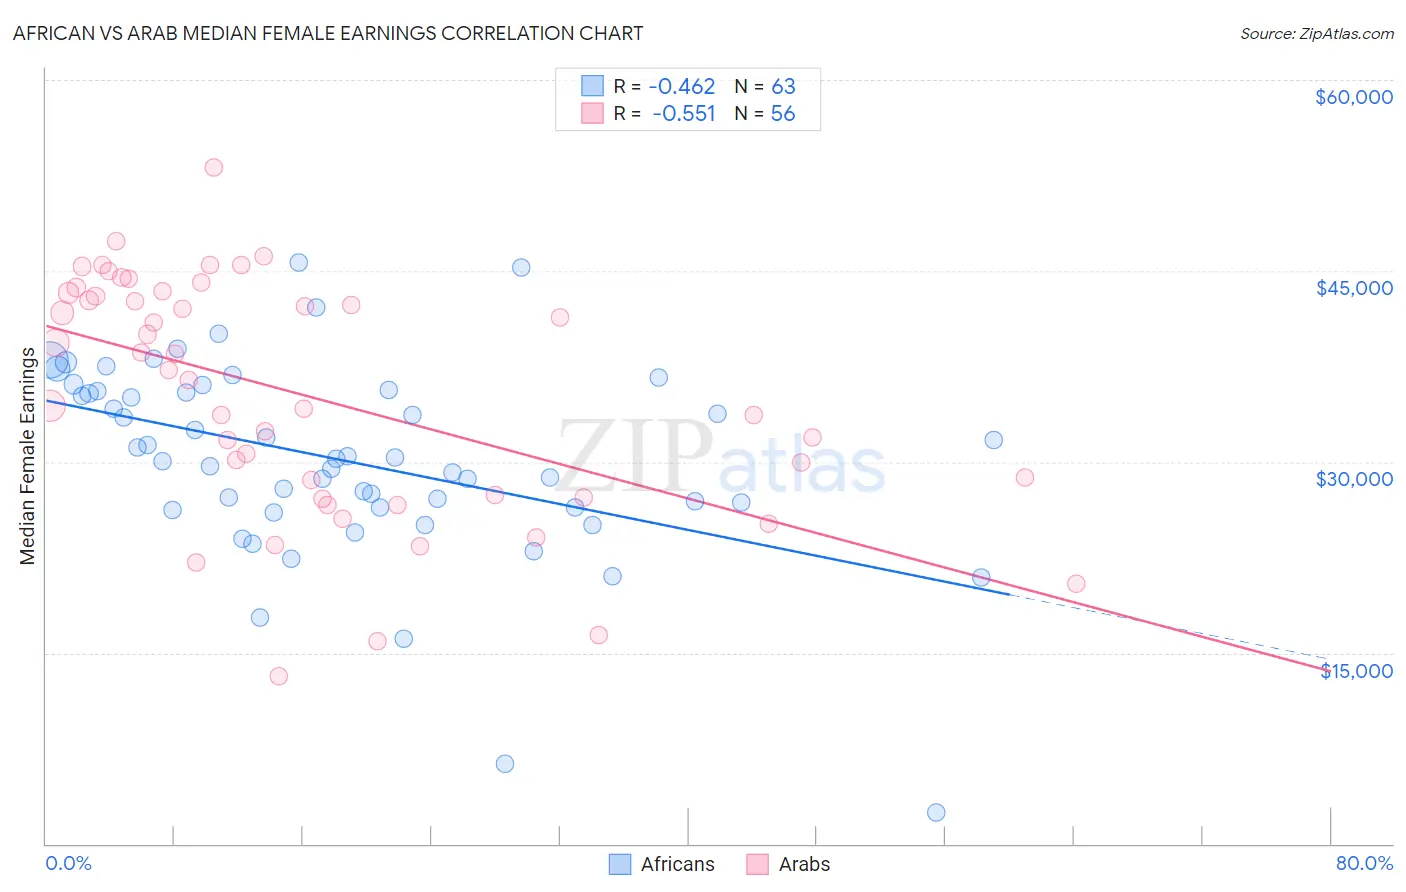
African vs Arab Median Female Earnings Correlation Chart
The statistical analysis conducted on geographies consisting of 469,717,352 people shows a moderate negative correlation between the proportion of Africans and median female earnings in the United States with a correlation coefficient (R) of -0.462 and weighted average of $36,530. Similarly, the statistical analysis conducted on geographies consisting of 486,538,152 people shows a substantial negative correlation between the proportion of Arabs and median female earnings in the United States with a correlation coefficient (R) of -0.551 and weighted average of $40,718, a difference of 11.5%.
Median Female Earnings Correlation Summary
| Measurement | African | Arab |
| Minimum | $2,499 | $13,173 |
| Maximum | $45,656 | $53,122 |
| Range | $43,157 | $39,949 |
| Mean | $30,089 | $35,183 |
| Median | $30,270 | $36,815 |
| Interquartile 25% (IQ1) | $26,393 | $27,287 |
| Interquartile 75% (IQ3) | $35,526 | $43,150 |
| Interquartile Range (IQR) | $9,133 | $15,863 |
| Standard Deviation (Sample) | $7,747 | $9,334 |
| Standard Deviation (Population) | $7,685 | $9,250 |
Similar Demographics by Median Female Earnings
Demographics Similar to Africans by Median Female Earnings
In terms of median female earnings, the demographic groups most similar to Africans are Central American ($36,492, a difference of 0.10%), Marshallese ($36,459, a difference of 0.19%), U.S. Virgin Islander ($36,424, a difference of 0.29%), Immigrants from Caribbean ($36,414, a difference of 0.32%), and Iroquois ($36,408, a difference of 0.34%).
| Demographics | Rating | Rank | Median Female Earnings |
| Cree | 0.4 /100 | #268 | Tragic $37,018 |
| Immigrants | Venezuela | 0.4 /100 | #269 | Tragic $37,003 |
| French American Indians | 0.3 /100 | #270 | Tragic $36,920 |
| Nicaraguans | 0.3 /100 | #271 | Tragic $36,904 |
| Immigrants | Dominican Republic | 0.3 /100 | #272 | Tragic $36,857 |
| Immigrants | Laos | 0.3 /100 | #273 | Tragic $36,841 |
| Immigrants | El Salvador | 0.2 /100 | #274 | Tragic $36,673 |
| Africans | 0.1 /100 | #275 | Tragic $36,530 |
| Central Americans | 0.1 /100 | #276 | Tragic $36,492 |
| Marshallese | 0.1 /100 | #277 | Tragic $36,459 |
| U.S. Virgin Islanders | 0.1 /100 | #278 | Tragic $36,424 |
| Immigrants | Caribbean | 0.1 /100 | #279 | Tragic $36,414 |
| Iroquois | 0.1 /100 | #280 | Tragic $36,408 |
| Spanish Americans | 0.1 /100 | #281 | Tragic $36,391 |
| Haitians | 0.1 /100 | #282 | Tragic $36,374 |
Demographics Similar to Arabs by Median Female Earnings
In terms of median female earnings, the demographic groups most similar to Arabs are Syrian ($40,727, a difference of 0.020%), Immigrants from Nepal ($40,704, a difference of 0.030%), Immigrants from Uganda ($40,739, a difference of 0.050%), Chilean ($40,757, a difference of 0.10%), and Immigrants from Guyana ($40,773, a difference of 0.14%).
| Demographics | Rating | Rank | Median Female Earnings |
| Ugandans | 92.2 /100 | #127 | Exceptional $40,889 |
| Carpatho Rusyns | 91.2 /100 | #128 | Exceptional $40,825 |
| Zimbabweans | 90.8 /100 | #129 | Exceptional $40,798 |
| Immigrants | Guyana | 90.3 /100 | #130 | Exceptional $40,773 |
| Chileans | 90.0 /100 | #131 | Exceptional $40,757 |
| Immigrants | Uganda | 89.7 /100 | #132 | Excellent $40,739 |
| Syrians | 89.5 /100 | #133 | Excellent $40,727 |
| Arabs | 89.3 /100 | #134 | Excellent $40,718 |
| Immigrants | Nepal | 89.0 /100 | #135 | Excellent $40,704 |
| Immigrants | Eastern Africa | 87.7 /100 | #136 | Excellent $40,644 |
| Pakistanis | 86.6 /100 | #137 | Excellent $40,596 |
| Taiwanese | 86.1 /100 | #138 | Excellent $40,576 |
| Immigrants | South Eastern Asia | 85.7 /100 | #139 | Excellent $40,558 |
| Serbians | 85.2 /100 | #140 | Excellent $40,539 |
| Immigrants | Syria | 84.1 /100 | #141 | Excellent $40,499 |