African vs Immigrants from Kuwait Median Female Earnings
COMPARE
African
Immigrants from Kuwait
Median Female Earnings
Median Female Earnings Comparison
Africans
Immigrants from Kuwait
$36,530
MEDIAN FEMALE EARNINGS
0.1/ 100
METRIC RATING
275th/ 347
METRIC RANK
$41,055
MEDIAN FEMALE EARNINGS
94.4/ 100
METRIC RATING
120th/ 347
METRIC RANK
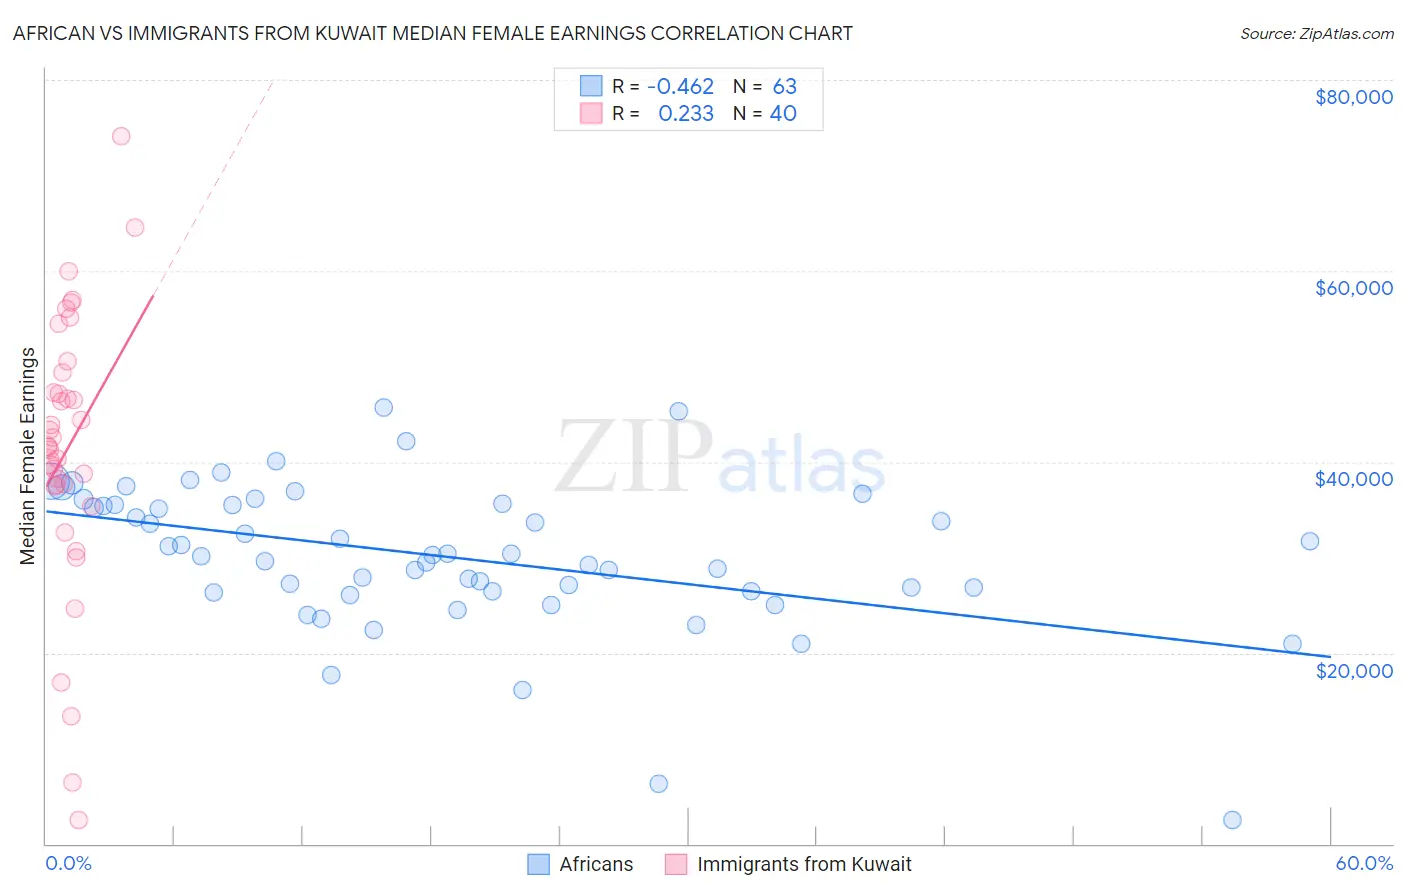
African vs Immigrants from Kuwait Median Female Earnings Correlation Chart
The statistical analysis conducted on geographies consisting of 469,717,352 people shows a moderate negative correlation between the proportion of Africans and median female earnings in the United States with a correlation coefficient (R) of -0.462 and weighted average of $36,530. Similarly, the statistical analysis conducted on geographies consisting of 136,915,503 people shows a weak positive correlation between the proportion of Immigrants from Kuwait and median female earnings in the United States with a correlation coefficient (R) of 0.233 and weighted average of $41,055, a difference of 12.4%.
Median Female Earnings Correlation Summary
| Measurement | African | Immigrants from Kuwait |
| Minimum | $2,499 | $2,499 |
| Maximum | $45,656 | $74,079 |
| Range | $43,157 | $71,580 |
| Mean | $30,089 | $41,287 |
| Median | $30,270 | $41,597 |
| Interquartile 25% (IQ1) | $26,393 | $37,555 |
| Interquartile 75% (IQ3) | $35,526 | $48,255 |
| Interquartile Range (IQR) | $9,133 | $10,700 |
| Standard Deviation (Sample) | $7,747 | $14,451 |
| Standard Deviation (Population) | $7,685 | $14,269 |
Similar Demographics by Median Female Earnings
Demographics Similar to Africans by Median Female Earnings
In terms of median female earnings, the demographic groups most similar to Africans are Central American ($36,492, a difference of 0.10%), Marshallese ($36,459, a difference of 0.19%), U.S. Virgin Islander ($36,424, a difference of 0.29%), Immigrants from Caribbean ($36,414, a difference of 0.32%), and Iroquois ($36,408, a difference of 0.34%).
| Demographics | Rating | Rank | Median Female Earnings |
| Cree | 0.4 /100 | #268 | Tragic $37,018 |
| Immigrants | Venezuela | 0.4 /100 | #269 | Tragic $37,003 |
| French American Indians | 0.3 /100 | #270 | Tragic $36,920 |
| Nicaraguans | 0.3 /100 | #271 | Tragic $36,904 |
| Immigrants | Dominican Republic | 0.3 /100 | #272 | Tragic $36,857 |
| Immigrants | Laos | 0.3 /100 | #273 | Tragic $36,841 |
| Immigrants | El Salvador | 0.2 /100 | #274 | Tragic $36,673 |
| Africans | 0.1 /100 | #275 | Tragic $36,530 |
| Central Americans | 0.1 /100 | #276 | Tragic $36,492 |
| Marshallese | 0.1 /100 | #277 | Tragic $36,459 |
| U.S. Virgin Islanders | 0.1 /100 | #278 | Tragic $36,424 |
| Immigrants | Caribbean | 0.1 /100 | #279 | Tragic $36,414 |
| Iroquois | 0.1 /100 | #280 | Tragic $36,408 |
| Spanish Americans | 0.1 /100 | #281 | Tragic $36,391 |
| Haitians | 0.1 /100 | #282 | Tragic $36,374 |
Demographics Similar to Immigrants from Kuwait by Median Female Earnings
In terms of median female earnings, the demographic groups most similar to Immigrants from Kuwait are Immigrants from Philippines ($41,114, a difference of 0.15%), Croatian ($40,993, a difference of 0.15%), Immigrants from Jordan ($40,977, a difference of 0.19%), Guyanese ($40,973, a difference of 0.20%), and Trinidadian and Tobagonian ($40,958, a difference of 0.24%).
| Demographics | Rating | Rank | Median Female Earnings |
| Macedonians | 96.4 /100 | #113 | Exceptional $41,286 |
| Immigrants | England | 96.4 /100 | #114 | Exceptional $41,277 |
| Koreans | 96.4 /100 | #115 | Exceptional $41,276 |
| Immigrants | Brazil | 96.4 /100 | #116 | Exceptional $41,273 |
| Barbadians | 96.3 /100 | #117 | Exceptional $41,261 |
| Immigrants | Lebanon | 95.6 /100 | #118 | Exceptional $41,183 |
| Immigrants | Philippines | 95.0 /100 | #119 | Exceptional $41,114 |
| Immigrants | Kuwait | 94.4 /100 | #120 | Exceptional $41,055 |
| Croatians | 93.7 /100 | #121 | Exceptional $40,993 |
| Immigrants | Jordan | 93.5 /100 | #122 | Exceptional $40,977 |
| Guyanese | 93.4 /100 | #123 | Exceptional $40,973 |
| Trinidadians and Tobagonians | 93.2 /100 | #124 | Exceptional $40,958 |
| Austrians | 92.7 /100 | #125 | Exceptional $40,923 |
| Immigrants | Trinidad and Tobago | 92.3 /100 | #126 | Exceptional $40,895 |
| Ugandans | 92.2 /100 | #127 | Exceptional $40,889 |