African vs German Median Female Earnings
COMPARE
African
German
Median Female Earnings
Median Female Earnings Comparison
Africans
Germans
$36,530
MEDIAN FEMALE EARNINGS
0.1/ 100
METRIC RATING
275th/ 347
METRIC RANK
$37,986
MEDIAN FEMALE EARNINGS
2.8/ 100
METRIC RATING
243rd/ 347
METRIC RANK
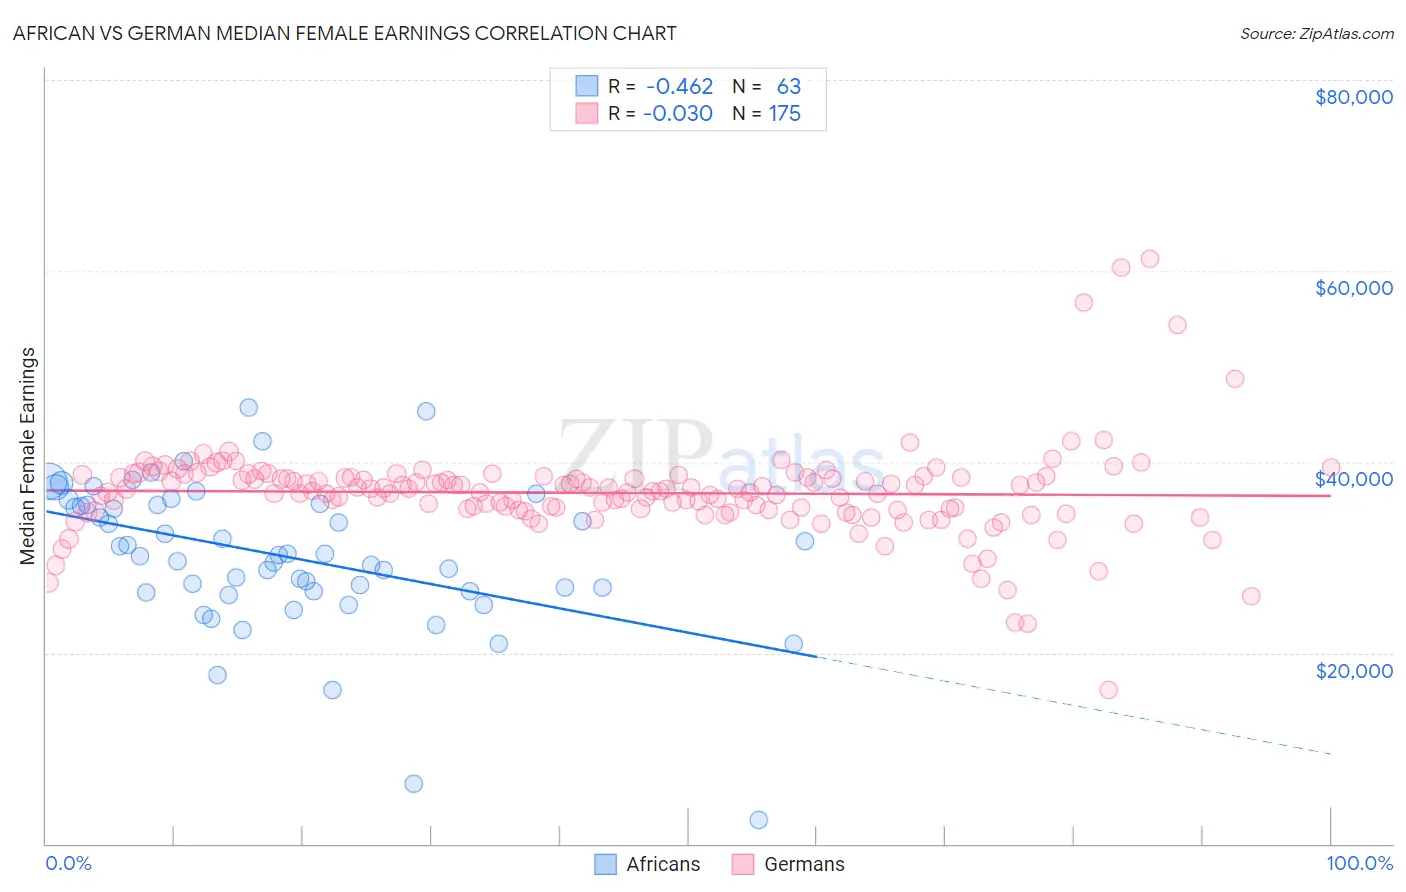
African vs German Median Female Earnings Correlation Chart
The statistical analysis conducted on geographies consisting of 469,717,352 people shows a moderate negative correlation between the proportion of Africans and median female earnings in the United States with a correlation coefficient (R) of -0.462 and weighted average of $36,530. Similarly, the statistical analysis conducted on geographies consisting of 578,410,378 people shows no correlation between the proportion of Germans and median female earnings in the United States with a correlation coefficient (R) of -0.030 and weighted average of $37,986, a difference of 4.0%.
Median Female Earnings Correlation Summary
| Measurement | African | German |
| Minimum | $2,499 | $16,161 |
| Maximum | $45,656 | $61,250 |
| Range | $43,157 | $45,089 |
| Mean | $30,089 | $36,748 |
| Median | $30,270 | $36,985 |
| Interquartile 25% (IQ1) | $26,393 | $34,926 |
| Interquartile 75% (IQ3) | $35,526 | $38,384 |
| Interquartile Range (IQR) | $9,133 | $3,458 |
| Standard Deviation (Sample) | $7,747 | $4,922 |
| Standard Deviation (Population) | $7,685 | $4,908 |
Similar Demographics by Median Female Earnings
Demographics Similar to Africans by Median Female Earnings
In terms of median female earnings, the demographic groups most similar to Africans are Central American ($36,492, a difference of 0.10%), Marshallese ($36,459, a difference of 0.19%), U.S. Virgin Islander ($36,424, a difference of 0.29%), Immigrants from Caribbean ($36,414, a difference of 0.32%), and Iroquois ($36,408, a difference of 0.34%).
| Demographics | Rating | Rank | Median Female Earnings |
| Cree | 0.4 /100 | #268 | Tragic $37,018 |
| Immigrants | Venezuela | 0.4 /100 | #269 | Tragic $37,003 |
| French American Indians | 0.3 /100 | #270 | Tragic $36,920 |
| Nicaraguans | 0.3 /100 | #271 | Tragic $36,904 |
| Immigrants | Dominican Republic | 0.3 /100 | #272 | Tragic $36,857 |
| Immigrants | Laos | 0.3 /100 | #273 | Tragic $36,841 |
| Immigrants | El Salvador | 0.2 /100 | #274 | Tragic $36,673 |
| Africans | 0.1 /100 | #275 | Tragic $36,530 |
| Central Americans | 0.1 /100 | #276 | Tragic $36,492 |
| Marshallese | 0.1 /100 | #277 | Tragic $36,459 |
| U.S. Virgin Islanders | 0.1 /100 | #278 | Tragic $36,424 |
| Immigrants | Caribbean | 0.1 /100 | #279 | Tragic $36,414 |
| Iroquois | 0.1 /100 | #280 | Tragic $36,408 |
| Spanish Americans | 0.1 /100 | #281 | Tragic $36,391 |
| Haitians | 0.1 /100 | #282 | Tragic $36,374 |
Demographics Similar to Germans by Median Female Earnings
In terms of median female earnings, the demographic groups most similar to Germans are Immigrants from Liberia ($37,970, a difference of 0.040%), Immigrants from Middle Africa ($37,965, a difference of 0.050%), Delaware ($37,964, a difference of 0.060%), Immigrants from Burma/Myanmar ($38,028, a difference of 0.11%), and Immigrants from Somalia ($37,914, a difference of 0.19%).
| Demographics | Rating | Rank | Median Female Earnings |
| Liberians | 4.4 /100 | #236 | Tragic $38,215 |
| Immigrants | Cabo Verde | 4.3 /100 | #237 | Tragic $38,208 |
| Alaska Natives | 4.3 /100 | #238 | Tragic $38,202 |
| English | 4.2 /100 | #239 | Tragic $38,196 |
| Finns | 4.0 /100 | #240 | Tragic $38,173 |
| Spanish | 3.5 /100 | #241 | Tragic $38,098 |
| Immigrants | Burma/Myanmar | 3.0 /100 | #242 | Tragic $38,028 |
| Germans | 2.8 /100 | #243 | Tragic $37,986 |
| Immigrants | Liberia | 2.7 /100 | #244 | Tragic $37,970 |
| Immigrants | Middle Africa | 2.7 /100 | #245 | Tragic $37,965 |
| Delaware | 2.6 /100 | #246 | Tragic $37,964 |
| Immigrants | Somalia | 2.4 /100 | #247 | Tragic $37,914 |
| Alaskan Athabascans | 2.3 /100 | #248 | Tragic $37,905 |
| Swiss | 2.3 /100 | #249 | Tragic $37,904 |
| Immigrants | Iraq | 2.2 /100 | #250 | Tragic $37,864 |