Black/African American vs Central American Divorced or Separated
COMPARE
Black/African American
Central American
Divorced or Separated
Divorced or Separated Comparison
Blacks/African Americans
Central Americans
13.6%
DIVORCED OR SEPARATED
0.0/ 100
METRIC RATING
331st/ 347
METRIC RANK
12.1%
DIVORCED OR SEPARATED
29.4/ 100
METRIC RATING
199th/ 347
METRIC RANK
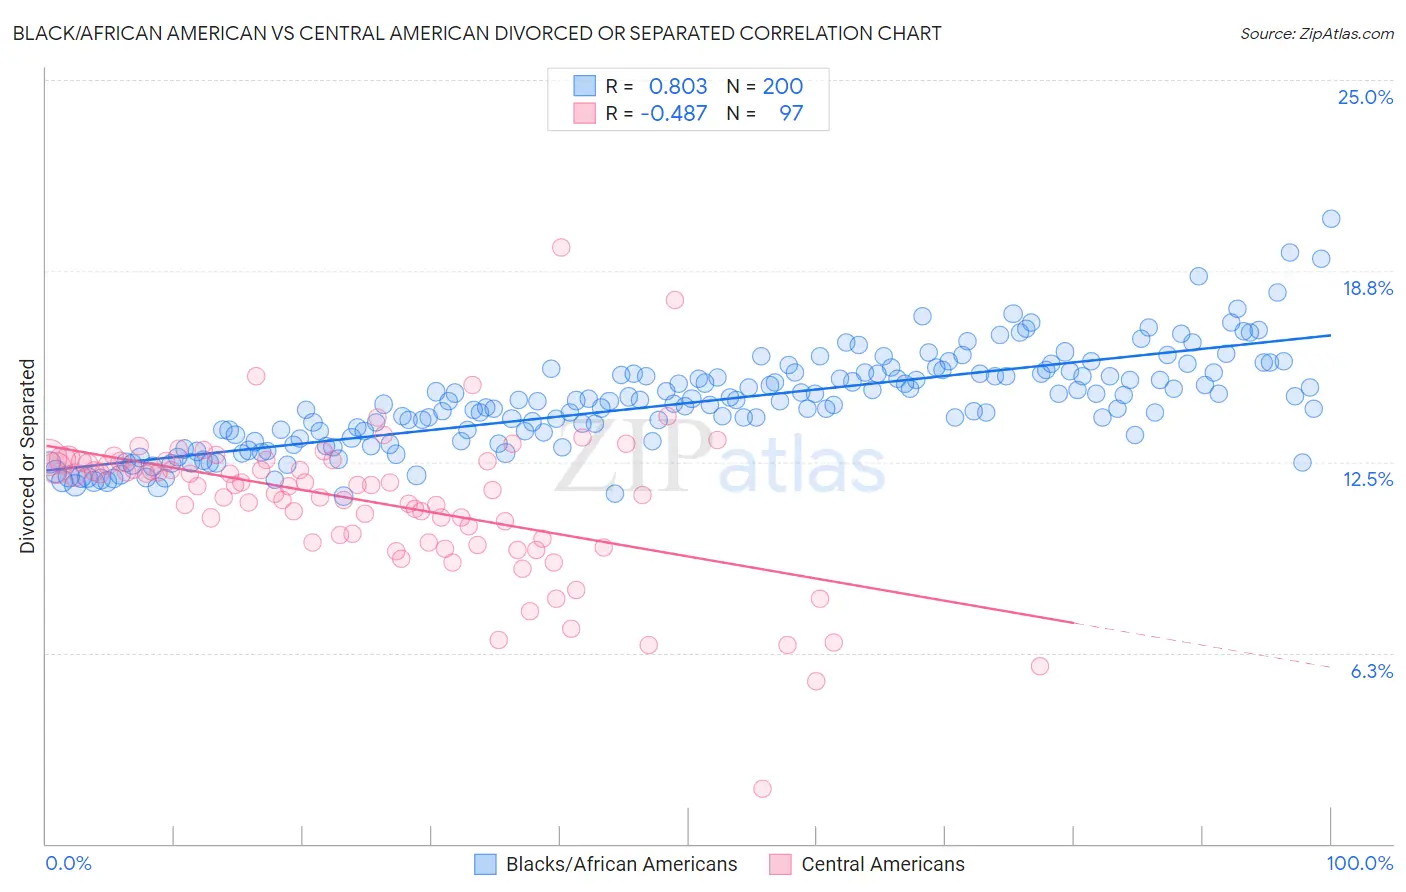
Black/African American vs Central American Divorced or Separated Correlation Chart
The statistical analysis conducted on geographies consisting of 565,552,203 people shows a very strong positive correlation between the proportion of Blacks/African Americans and percentage of population currently divorced or separated in the United States with a correlation coefficient (R) of 0.803 and weighted average of 13.6%. Similarly, the statistical analysis conducted on geographies consisting of 504,272,627 people shows a moderate negative correlation between the proportion of Central Americans and percentage of population currently divorced or separated in the United States with a correlation coefficient (R) of -0.487 and weighted average of 12.1%, a difference of 12.2%.
Divorced or Separated Correlation Summary
| Measurement | Black/African American | Central American |
| Minimum | 11.4% | 1.8% |
| Maximum | 20.4% | 19.5% |
| Range | 9.1% | 17.7% |
| Mean | 14.4% | 11.2% |
| Median | 14.4% | 11.7% |
| Interquartile 25% (IQ1) | 13.2% | 9.9% |
| Interquartile 75% (IQ3) | 15.4% | 12.5% |
| Interquartile Range (IQR) | 2.2% | 2.6% |
| Standard Deviation (Sample) | 1.6% | 2.4% |
| Standard Deviation (Population) | 1.6% | 2.4% |
Similar Demographics by Divorced or Separated
Demographics Similar to Blacks/African Americans by Divorced or Separated
In terms of divorced or separated, the demographic groups most similar to Blacks/African Americans are Paiute (13.6%, a difference of 0.13%), Houma (13.6%, a difference of 0.24%), Immigrants from Caribbean (13.6%, a difference of 0.39%), Cherokee (13.7%, a difference of 0.76%), and Comanche (13.5%, a difference of 0.77%).
| Demographics | Rating | Rank | Divorced or Separated |
| Osage | 0.0 /100 | #324 | Tragic 13.4% |
| Potawatomi | 0.0 /100 | #325 | Tragic 13.5% |
| Immigrants | Congo | 0.0 /100 | #326 | Tragic 13.5% |
| Comanche | 0.0 /100 | #327 | Tragic 13.5% |
| Immigrants | Caribbean | 0.0 /100 | #328 | Tragic 13.6% |
| Houma | 0.0 /100 | #329 | Tragic 13.6% |
| Paiute | 0.0 /100 | #330 | Tragic 13.6% |
| Blacks/African Americans | 0.0 /100 | #331 | Tragic 13.6% |
| Cherokee | 0.0 /100 | #332 | Tragic 13.7% |
| Puerto Ricans | 0.0 /100 | #333 | Tragic 13.9% |
| Immigrants | Bahamas | 0.0 /100 | #334 | Tragic 13.9% |
| Dutch West Indians | 0.0 /100 | #335 | Tragic 14.0% |
| Shoshone | 0.0 /100 | #336 | Tragic 14.0% |
| Crow | 0.0 /100 | #337 | Tragic 14.1% |
| Choctaw | 0.0 /100 | #338 | Tragic 14.1% |
Demographics Similar to Central Americans by Divorced or Separated
In terms of divorced or separated, the demographic groups most similar to Central Americans are Nigerian (12.1%, a difference of 0.030%), South American (12.2%, a difference of 0.030%), Immigrants from Burma/Myanmar (12.1%, a difference of 0.040%), Immigrants from Africa (12.1%, a difference of 0.040%), and Immigrants from England (12.1%, a difference of 0.080%).
| Demographics | Rating | Rank | Divorced or Separated |
| Norwegians | 33.2 /100 | #192 | Fair 12.1% |
| Immigrants | Thailand | 32.5 /100 | #193 | Fair 12.1% |
| Immigrants | Eritrea | 31.9 /100 | #194 | Fair 12.1% |
| Immigrants | England | 31.4 /100 | #195 | Fair 12.1% |
| Immigrants | Burma/Myanmar | 30.4 /100 | #196 | Fair 12.1% |
| Immigrants | Africa | 30.3 /100 | #197 | Fair 12.1% |
| Nigerians | 30.1 /100 | #198 | Fair 12.1% |
| Central Americans | 29.4 /100 | #199 | Fair 12.1% |
| South Americans | 28.6 /100 | #200 | Fair 12.2% |
| Guatemalans | 26.9 /100 | #201 | Fair 12.2% |
| Portuguese | 23.5 /100 | #202 | Fair 12.2% |
| Immigrants | Guatemala | 23.2 /100 | #203 | Fair 12.2% |
| Kenyans | 21.8 /100 | #204 | Fair 12.2% |
| Immigrants | Costa Rica | 21.3 /100 | #205 | Fair 12.2% |
| Slovaks | 21.0 /100 | #206 | Fair 12.2% |