Black/African American vs Immigrants from Peru Divorced or Separated
COMPARE
Black/African American
Immigrants from Peru
Divorced or Separated
Divorced or Separated Comparison
Blacks/African Americans
Immigrants from Peru
13.6%
DIVORCED OR SEPARATED
0.0/ 100
METRIC RATING
331st/ 347
METRIC RANK
12.0%
DIVORCED OR SEPARATED
57.0/ 100
METRIC RATING
169th/ 347
METRIC RANK
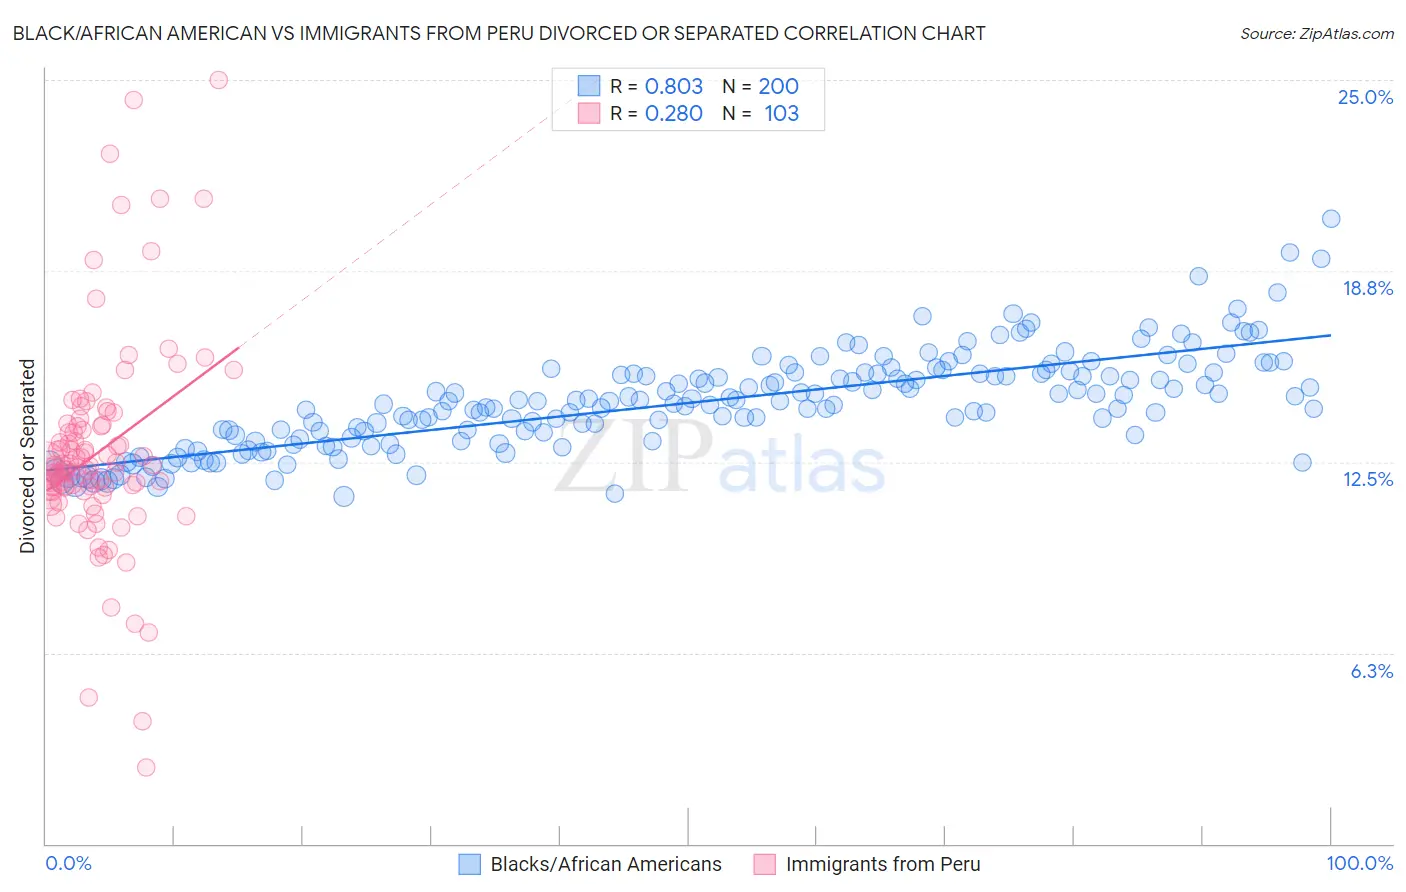
Black/African American vs Immigrants from Peru Divorced or Separated Correlation Chart
The statistical analysis conducted on geographies consisting of 565,552,203 people shows a very strong positive correlation between the proportion of Blacks/African Americans and percentage of population currently divorced or separated in the United States with a correlation coefficient (R) of 0.803 and weighted average of 13.6%. Similarly, the statistical analysis conducted on geographies consisting of 328,793,574 people shows a weak positive correlation between the proportion of Immigrants from Peru and percentage of population currently divorced or separated in the United States with a correlation coefficient (R) of 0.280 and weighted average of 12.0%, a difference of 13.3%.
Divorced or Separated Correlation Summary
| Measurement | Black/African American | Immigrants from Peru |
| Minimum | 11.4% | 2.5% |
| Maximum | 20.4% | 25.0% |
| Range | 9.1% | 22.5% |
| Mean | 14.4% | 12.8% |
| Median | 14.4% | 12.4% |
| Interquartile 25% (IQ1) | 13.2% | 11.6% |
| Interquartile 75% (IQ3) | 15.4% | 13.7% |
| Interquartile Range (IQR) | 2.2% | 2.1% |
| Standard Deviation (Sample) | 1.6% | 3.5% |
| Standard Deviation (Population) | 1.6% | 3.5% |
Similar Demographics by Divorced or Separated
Demographics Similar to Blacks/African Americans by Divorced or Separated
In terms of divorced or separated, the demographic groups most similar to Blacks/African Americans are Paiute (13.6%, a difference of 0.13%), Houma (13.6%, a difference of 0.24%), Immigrants from Caribbean (13.6%, a difference of 0.39%), Cherokee (13.7%, a difference of 0.76%), and Comanche (13.5%, a difference of 0.77%).
| Demographics | Rating | Rank | Divorced or Separated |
| Osage | 0.0 /100 | #324 | Tragic 13.4% |
| Potawatomi | 0.0 /100 | #325 | Tragic 13.5% |
| Immigrants | Congo | 0.0 /100 | #326 | Tragic 13.5% |
| Comanche | 0.0 /100 | #327 | Tragic 13.5% |
| Immigrants | Caribbean | 0.0 /100 | #328 | Tragic 13.6% |
| Houma | 0.0 /100 | #329 | Tragic 13.6% |
| Paiute | 0.0 /100 | #330 | Tragic 13.6% |
| Blacks/African Americans | 0.0 /100 | #331 | Tragic 13.6% |
| Cherokee | 0.0 /100 | #332 | Tragic 13.7% |
| Puerto Ricans | 0.0 /100 | #333 | Tragic 13.9% |
| Immigrants | Bahamas | 0.0 /100 | #334 | Tragic 13.9% |
| Dutch West Indians | 0.0 /100 | #335 | Tragic 14.0% |
| Shoshone | 0.0 /100 | #336 | Tragic 14.0% |
| Crow | 0.0 /100 | #337 | Tragic 14.1% |
| Choctaw | 0.0 /100 | #338 | Tragic 14.1% |
Demographics Similar to Immigrants from Peru by Divorced or Separated
In terms of divorced or separated, the demographic groups most similar to Immigrants from Peru are Serbian (12.0%, a difference of 0.0%), Mexican American Indian (12.0%, a difference of 0.040%), Ethiopian (12.0%, a difference of 0.050%), Tohono O'odham (12.0%, a difference of 0.12%), and Costa Rican (12.0%, a difference of 0.13%).
| Demographics | Rating | Rank | Divorced or Separated |
| Samoans | 64.3 /100 | #162 | Good 12.0% |
| Navajo | 63.9 /100 | #163 | Good 12.0% |
| Swiss | 63.6 /100 | #164 | Good 12.0% |
| German Russians | 61.8 /100 | #165 | Good 12.0% |
| Tohono O'odham | 60.4 /100 | #166 | Good 12.0% |
| Ethiopians | 58.5 /100 | #167 | Average 12.0% |
| Serbians | 57.1 /100 | #168 | Average 12.0% |
| Immigrants | Peru | 57.0 /100 | #169 | Average 12.0% |
| Mexican American Indians | 55.8 /100 | #170 | Average 12.0% |
| Costa Ricans | 53.3 /100 | #171 | Average 12.0% |
| Immigrants | Mexico | 53.2 /100 | #172 | Average 12.0% |
| Immigrants | Moldova | 50.4 /100 | #173 | Average 12.1% |
| Hawaiians | 50.0 /100 | #174 | Average 12.1% |
| Immigrants | Sierra Leone | 50.0 /100 | #175 | Average 12.1% |
| Pennsylvania Germans | 48.9 /100 | #176 | Average 12.1% |