Black/African American vs Immigrants from Laos Divorced or Separated
COMPARE
Black/African American
Immigrants from Laos
Divorced or Separated
Divorced or Separated Comparison
Blacks/African Americans
Immigrants from Laos
13.6%
DIVORCED OR SEPARATED
0.0/ 100
METRIC RATING
331st/ 347
METRIC RANK
12.4%
DIVORCED OR SEPARATED
4.2/ 100
METRIC RATING
237th/ 347
METRIC RANK
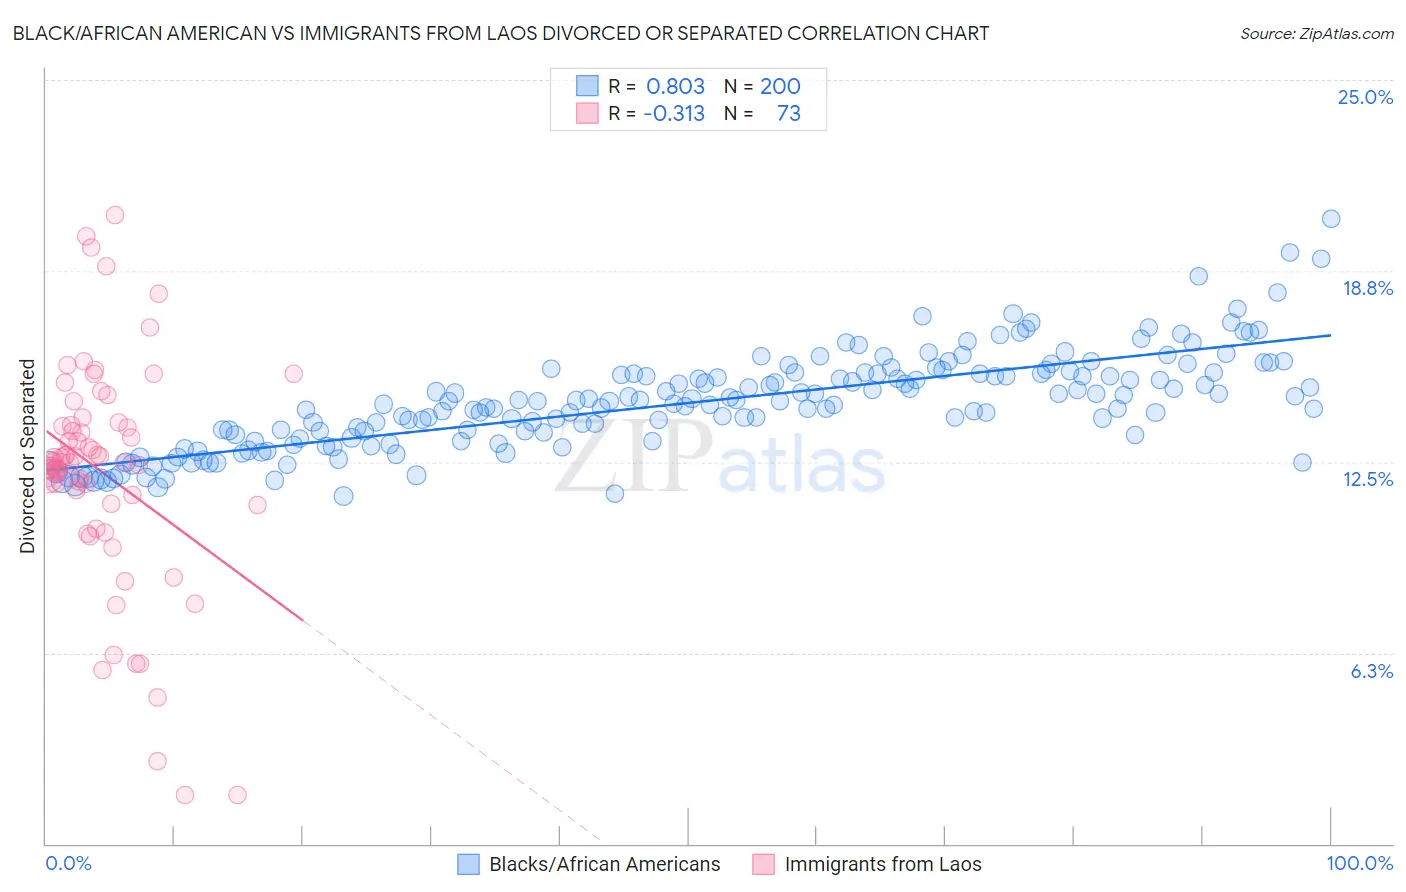
Black/African American vs Immigrants from Laos Divorced or Separated Correlation Chart
The statistical analysis conducted on geographies consisting of 565,552,203 people shows a very strong positive correlation between the proportion of Blacks/African Americans and percentage of population currently divorced or separated in the United States with a correlation coefficient (R) of 0.803 and weighted average of 13.6%. Similarly, the statistical analysis conducted on geographies consisting of 201,474,624 people shows a mild negative correlation between the proportion of Immigrants from Laos and percentage of population currently divorced or separated in the United States with a correlation coefficient (R) of -0.313 and weighted average of 12.4%, a difference of 10.1%.
Divorced or Separated Correlation Summary
| Measurement | Black/African American | Immigrants from Laos |
| Minimum | 11.4% | 1.6% |
| Maximum | 20.4% | 20.6% |
| Range | 9.1% | 19.0% |
| Mean | 14.4% | 12.1% |
| Median | 14.4% | 12.5% |
| Interquartile 25% (IQ1) | 13.2% | 11.1% |
| Interquartile 75% (IQ3) | 15.4% | 13.7% |
| Interquartile Range (IQR) | 2.2% | 2.6% |
| Standard Deviation (Sample) | 1.6% | 3.8% |
| Standard Deviation (Population) | 1.6% | 3.7% |
Similar Demographics by Divorced or Separated
Demographics Similar to Blacks/African Americans by Divorced or Separated
In terms of divorced or separated, the demographic groups most similar to Blacks/African Americans are Paiute (13.6%, a difference of 0.13%), Houma (13.6%, a difference of 0.24%), Immigrants from Caribbean (13.6%, a difference of 0.39%), Cherokee (13.7%, a difference of 0.76%), and Comanche (13.5%, a difference of 0.77%).
| Demographics | Rating | Rank | Divorced or Separated |
| Osage | 0.0 /100 | #324 | Tragic 13.4% |
| Potawatomi | 0.0 /100 | #325 | Tragic 13.5% |
| Immigrants | Congo | 0.0 /100 | #326 | Tragic 13.5% |
| Comanche | 0.0 /100 | #327 | Tragic 13.5% |
| Immigrants | Caribbean | 0.0 /100 | #328 | Tragic 13.6% |
| Houma | 0.0 /100 | #329 | Tragic 13.6% |
| Paiute | 0.0 /100 | #330 | Tragic 13.6% |
| Blacks/African Americans | 0.0 /100 | #331 | Tragic 13.6% |
| Cherokee | 0.0 /100 | #332 | Tragic 13.7% |
| Puerto Ricans | 0.0 /100 | #333 | Tragic 13.9% |
| Immigrants | Bahamas | 0.0 /100 | #334 | Tragic 13.9% |
| Dutch West Indians | 0.0 /100 | #335 | Tragic 14.0% |
| Shoshone | 0.0 /100 | #336 | Tragic 14.0% |
| Crow | 0.0 /100 | #337 | Tragic 14.1% |
| Choctaw | 0.0 /100 | #338 | Tragic 14.1% |
Demographics Similar to Immigrants from Laos by Divorced or Separated
In terms of divorced or separated, the demographic groups most similar to Immigrants from Laos are Colombian (12.4%, a difference of 0.0%), Immigrants from Bosnia and Herzegovina (12.4%, a difference of 0.030%), Sudanese (12.4%, a difference of 0.030%), Immigrants from Germany (12.4%, a difference of 0.040%), and West Indian (12.4%, a difference of 0.050%).
| Demographics | Rating | Rank | Divorced or Separated |
| Yakama | 7.8 /100 | #230 | Tragic 12.3% |
| Yugoslavians | 6.6 /100 | #231 | Tragic 12.3% |
| Canadians | 5.3 /100 | #232 | Tragic 12.4% |
| Malaysians | 4.8 /100 | #233 | Tragic 12.4% |
| West Indians | 4.4 /100 | #234 | Tragic 12.4% |
| Immigrants | Bosnia and Herzegovina | 4.3 /100 | #235 | Tragic 12.4% |
| Colombians | 4.2 /100 | #236 | Tragic 12.4% |
| Immigrants | Laos | 4.2 /100 | #237 | Tragic 12.4% |
| Sudanese | 4.0 /100 | #238 | Tragic 12.4% |
| Immigrants | Germany | 4.0 /100 | #239 | Tragic 12.4% |
| British West Indians | 3.7 /100 | #240 | Tragic 12.4% |
| Uruguayans | 3.4 /100 | #241 | Tragic 12.4% |
| Dutch | 3.1 /100 | #242 | Tragic 12.4% |
| Immigrants | Latin America | 2.8 /100 | #243 | Tragic 12.4% |
| Alaska Natives | 2.5 /100 | #244 | Tragic 12.4% |