Alaskan Athabascan vs Immigrants from Micronesia Married-couple Households
COMPARE
Alaskan Athabascan
Immigrants from Micronesia
Married-couple Households
Married-couple Households Comparison
Alaskan Athabascans
Immigrants from Micronesia
43.6%
MARRIED-COUPLE HOUSEHOLDS
0.2/ 100
METRIC RATING
261st/ 347
METRIC RANK
44.9%
MARRIED-COUPLE HOUSEHOLDS
2.6/ 100
METRIC RATING
224th/ 347
METRIC RANK
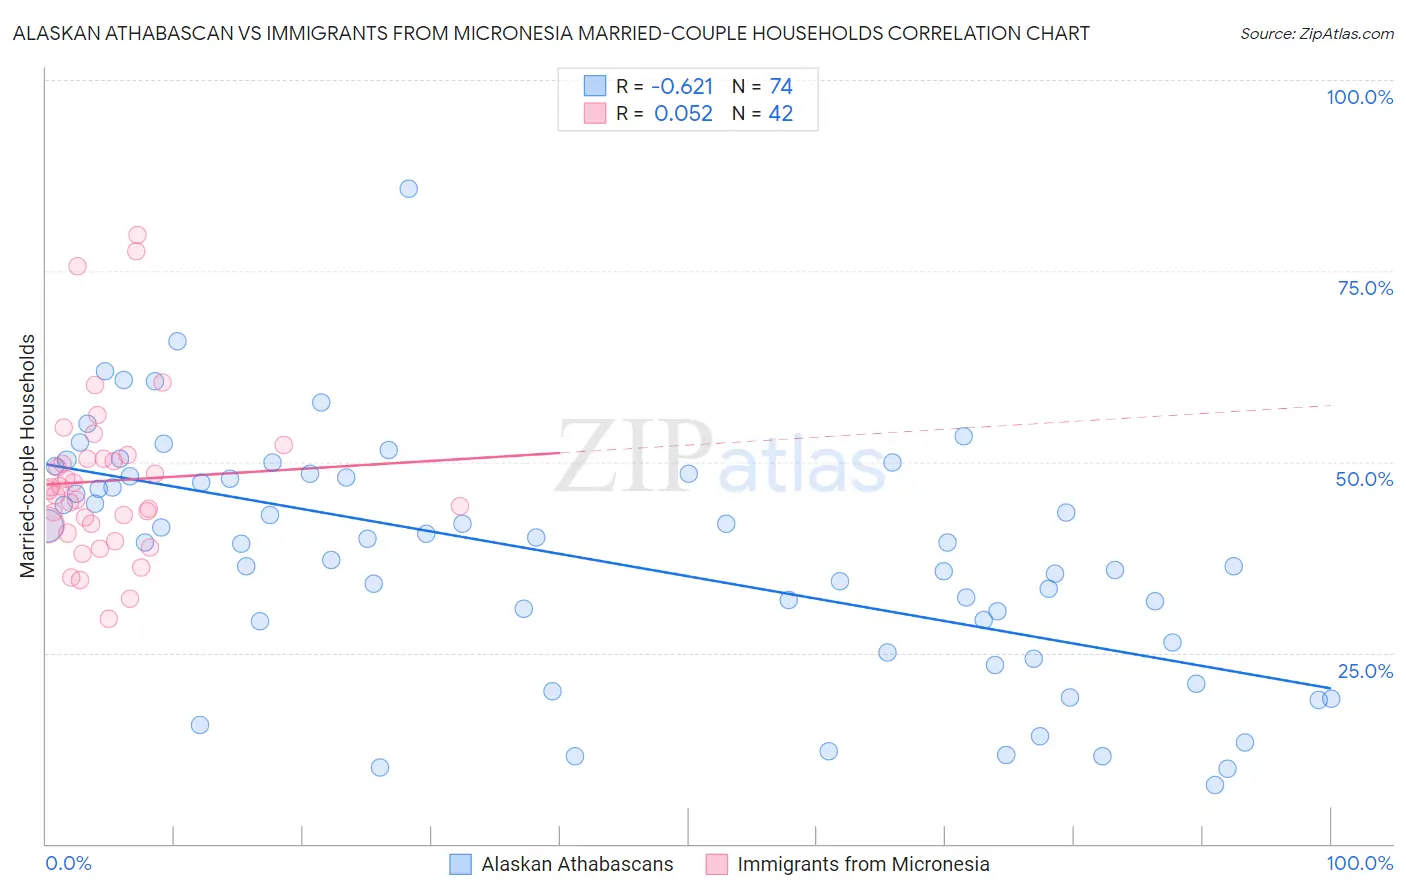
Alaskan Athabascan vs Immigrants from Micronesia Married-couple Households Correlation Chart
The statistical analysis conducted on geographies consisting of 45,814,810 people shows a significant negative correlation between the proportion of Alaskan Athabascans and percentage of married-couple family households in the United States with a correlation coefficient (R) of -0.621 and weighted average of 43.6%. Similarly, the statistical analysis conducted on geographies consisting of 61,600,267 people shows a slight positive correlation between the proportion of Immigrants from Micronesia and percentage of married-couple family households in the United States with a correlation coefficient (R) of 0.052 and weighted average of 44.9%, a difference of 2.8%.
Married-couple Households Correlation Summary
| Measurement | Alaskan Athabascan | Immigrants from Micronesia |
| Minimum | 7.7% | 29.5% |
| Maximum | 85.7% | 79.7% |
| Range | 78.0% | 50.3% |
| Mean | 37.3% | 47.5% |
| Median | 39.4% | 45.9% |
| Interquartile 25% (IQ1) | 26.4% | 41.7% |
| Interquartile 75% (IQ3) | 48.1% | 50.4% |
| Interquartile Range (IQR) | 21.7% | 8.7% |
| Standard Deviation (Sample) | 15.6% | 10.9% |
| Standard Deviation (Population) | 15.5% | 10.7% |
Similar Demographics by Married-couple Households
Demographics Similar to Alaskan Athabascans by Married-couple Households
In terms of married-couple households, the demographic groups most similar to Alaskan Athabascans are Vietnamese (43.6%, a difference of 0.060%), Immigrants from Cameroon (43.7%, a difference of 0.13%), Cree (43.6%, a difference of 0.17%), Iroquois (43.7%, a difference of 0.22%), and Central American Indian (43.8%, a difference of 0.25%).
| Demographics | Rating | Rank | Married-couple Households |
| Apache | 0.3 /100 | #254 | Tragic 43.9% |
| Shoshone | 0.3 /100 | #255 | Tragic 43.9% |
| Ugandans | 0.3 /100 | #256 | Tragic 43.8% |
| Blackfeet | 0.2 /100 | #257 | Tragic 43.8% |
| Central American Indians | 0.2 /100 | #258 | Tragic 43.8% |
| Iroquois | 0.2 /100 | #259 | Tragic 43.7% |
| Immigrants | Cameroon | 0.2 /100 | #260 | Tragic 43.7% |
| Alaskan Athabascans | 0.2 /100 | #261 | Tragic 43.6% |
| Vietnamese | 0.2 /100 | #262 | Tragic 43.6% |
| Cree | 0.1 /100 | #263 | Tragic 43.6% |
| Bangladeshis | 0.1 /100 | #264 | Tragic 43.5% |
| Moroccans | 0.1 /100 | #265 | Tragic 43.5% |
| Ecuadorians | 0.1 /100 | #266 | Tragic 43.5% |
| Natives/Alaskans | 0.1 /100 | #267 | Tragic 43.5% |
| Immigrants | Burma/Myanmar | 0.1 /100 | #268 | Tragic 43.4% |
Demographics Similar to Immigrants from Micronesia by Married-couple Households
In terms of married-couple households, the demographic groups most similar to Immigrants from Micronesia are Dutch West Indian (44.9%, a difference of 0.020%), Immigrants from Cambodia (44.9%, a difference of 0.030%), Alsatian (44.8%, a difference of 0.12%), Salvadoran (44.7%, a difference of 0.31%), and Kenyan (44.7%, a difference of 0.43%).
| Demographics | Rating | Rank | Married-couple Households |
| Panamanians | 5.5 /100 | #217 | Tragic 45.2% |
| Immigrants | Azores | 5.3 /100 | #218 | Tragic 45.2% |
| Nicaraguans | 5.3 /100 | #219 | Tragic 45.2% |
| Immigrants | Thailand | 5.1 /100 | #220 | Tragic 45.2% |
| Tlingit-Haida | 4.9 /100 | #221 | Tragic 45.1% |
| Immigrants | Laos | 4.6 /100 | #222 | Tragic 45.1% |
| Immigrants | Cambodia | 2.7 /100 | #223 | Tragic 44.9% |
| Immigrants | Micronesia | 2.6 /100 | #224 | Tragic 44.9% |
| Dutch West Indians | 2.6 /100 | #225 | Tragic 44.9% |
| Alsatians | 2.3 /100 | #226 | Tragic 44.8% |
| Salvadorans | 1.9 /100 | #227 | Tragic 44.7% |
| Kenyans | 1.7 /100 | #228 | Tragic 44.7% |
| Immigrants | Latin America | 1.6 /100 | #229 | Tragic 44.7% |
| Soviet Union | 1.6 /100 | #230 | Tragic 44.6% |
| Houma | 1.5 /100 | #231 | Tragic 44.6% |