Zimbabwean vs Haitian Married-couple Households
COMPARE
Zimbabwean
Haitian
Married-couple Households
Married-couple Households Comparison
Zimbabweans
Haitians
47.4%
MARRIED-COUPLE HOUSEHOLDS
89.2/ 100
METRIC RATING
124th/ 347
METRIC RANK
41.2%
MARRIED-COUPLE HOUSEHOLDS
0.0/ 100
METRIC RATING
310th/ 347
METRIC RANK
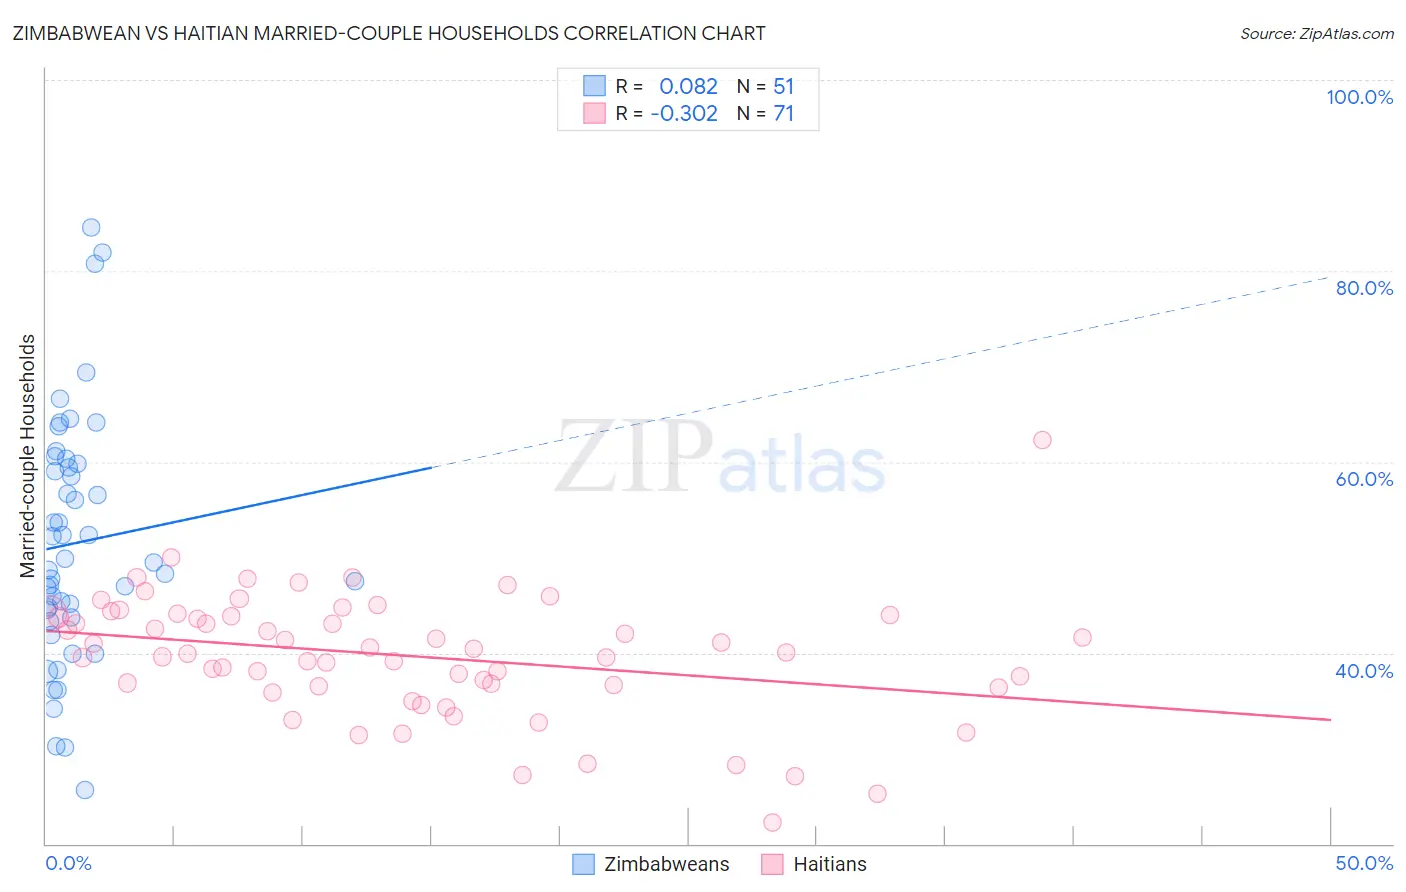
Zimbabwean vs Haitian Married-couple Households Correlation Chart
The statistical analysis conducted on geographies consisting of 69,192,017 people shows a slight positive correlation between the proportion of Zimbabweans and percentage of married-couple family households in the United States with a correlation coefficient (R) of 0.082 and weighted average of 47.4%. Similarly, the statistical analysis conducted on geographies consisting of 287,684,168 people shows a mild negative correlation between the proportion of Haitians and percentage of married-couple family households in the United States with a correlation coefficient (R) of -0.302 and weighted average of 41.2%, a difference of 15.0%.
Married-couple Households Correlation Summary
| Measurement | Zimbabwean | Haitian |
| Minimum | 25.7% | 22.3% |
| Maximum | 84.6% | 62.2% |
| Range | 58.9% | 40.0% |
| Mean | 51.5% | 39.7% |
| Median | 49.5% | 40.1% |
| Interquartile 25% (IQ1) | 43.8% | 36.5% |
| Interquartile 75% (IQ3) | 59.8% | 43.9% |
| Interquartile Range (IQR) | 16.0% | 7.4% |
| Standard Deviation (Sample) | 12.8% | 6.5% |
| Standard Deviation (Population) | 12.6% | 6.4% |
Similar Demographics by Married-couple Households
Demographics Similar to Zimbabweans by Married-couple Households
In terms of married-couple households, the demographic groups most similar to Zimbabweans are Immigrants from Venezuela (47.4%, a difference of 0.010%), Australian (47.4%, a difference of 0.020%), Pakistani (47.3%, a difference of 0.050%), Okinawan (47.4%, a difference of 0.090%), and Celtic (47.3%, a difference of 0.10%).
| Demographics | Rating | Rank | Married-couple Households |
| French Canadians | 92.4 /100 | #117 | Exceptional 47.5% |
| Immigrants | Germany | 92.4 /100 | #118 | Exceptional 47.5% |
| Chileans | 92.2 /100 | #119 | Exceptional 47.5% |
| Puget Sound Salish | 90.5 /100 | #120 | Exceptional 47.4% |
| Immigrants | Eastern Europe | 90.3 /100 | #121 | Exceptional 47.4% |
| Okinawans | 90.1 /100 | #122 | Exceptional 47.4% |
| Immigrants | Venezuela | 89.3 /100 | #123 | Excellent 47.4% |
| Zimbabweans | 89.2 /100 | #124 | Excellent 47.4% |
| Australians | 89.0 /100 | #125 | Excellent 47.4% |
| Pakistanis | 88.6 /100 | #126 | Excellent 47.3% |
| Celtics | 88.1 /100 | #127 | Excellent 47.3% |
| Immigrants | Peru | 87.9 /100 | #128 | Excellent 47.3% |
| Immigrants | Iraq | 87.8 /100 | #129 | Excellent 47.3% |
| Immigrants | Hungary | 87.8 /100 | #130 | Excellent 47.3% |
| Immigrants | Denmark | 87.5 /100 | #131 | Excellent 47.3% |
Demographics Similar to Haitians by Married-couple Households
In terms of married-couple households, the demographic groups most similar to Haitians are Immigrants from Trinidad and Tobago (41.2%, a difference of 0.070%), Crow (41.4%, a difference of 0.42%), Immigrants from Western Africa (41.4%, a difference of 0.43%), Guyanese (41.4%, a difference of 0.44%), and Colville (41.0%, a difference of 0.50%).
| Demographics | Rating | Rank | Married-couple Households |
| Sub-Saharan Africans | 0.0 /100 | #303 | Tragic 41.6% |
| Immigrants | Guyana | 0.0 /100 | #304 | Tragic 41.6% |
| Sioux | 0.0 /100 | #305 | Tragic 41.5% |
| Guyanese | 0.0 /100 | #306 | Tragic 41.4% |
| Immigrants | Western Africa | 0.0 /100 | #307 | Tragic 41.4% |
| Crow | 0.0 /100 | #308 | Tragic 41.4% |
| Immigrants | Trinidad and Tobago | 0.0 /100 | #309 | Tragic 41.2% |
| Haitians | 0.0 /100 | #310 | Tragic 41.2% |
| Colville | 0.0 /100 | #311 | Tragic 41.0% |
| Africans | 0.0 /100 | #312 | Tragic 40.9% |
| Immigrants | Haiti | 0.0 /100 | #313 | Tragic 40.9% |
| Jamaicans | 0.0 /100 | #314 | Tragic 40.9% |
| Trinidadians and Tobagonians | 0.0 /100 | #315 | Tragic 40.9% |
| Immigrants | Caribbean | 0.0 /100 | #316 | Tragic 40.8% |
| Immigrants | Jamaica | 0.0 /100 | #317 | Tragic 40.7% |