Zimbabwean vs Immigrants from Switzerland Married-couple Households
COMPARE
Zimbabwean
Immigrants from Switzerland
Married-couple Households
Married-couple Households Comparison
Zimbabweans
Immigrants from Switzerland
47.4%
MARRIED-COUPLE HOUSEHOLDS
89.2/ 100
METRIC RATING
124th/ 347
METRIC RANK
46.2%
MARRIED-COUPLE HOUSEHOLDS
36.9/ 100
METRIC RATING
184th/ 347
METRIC RANK
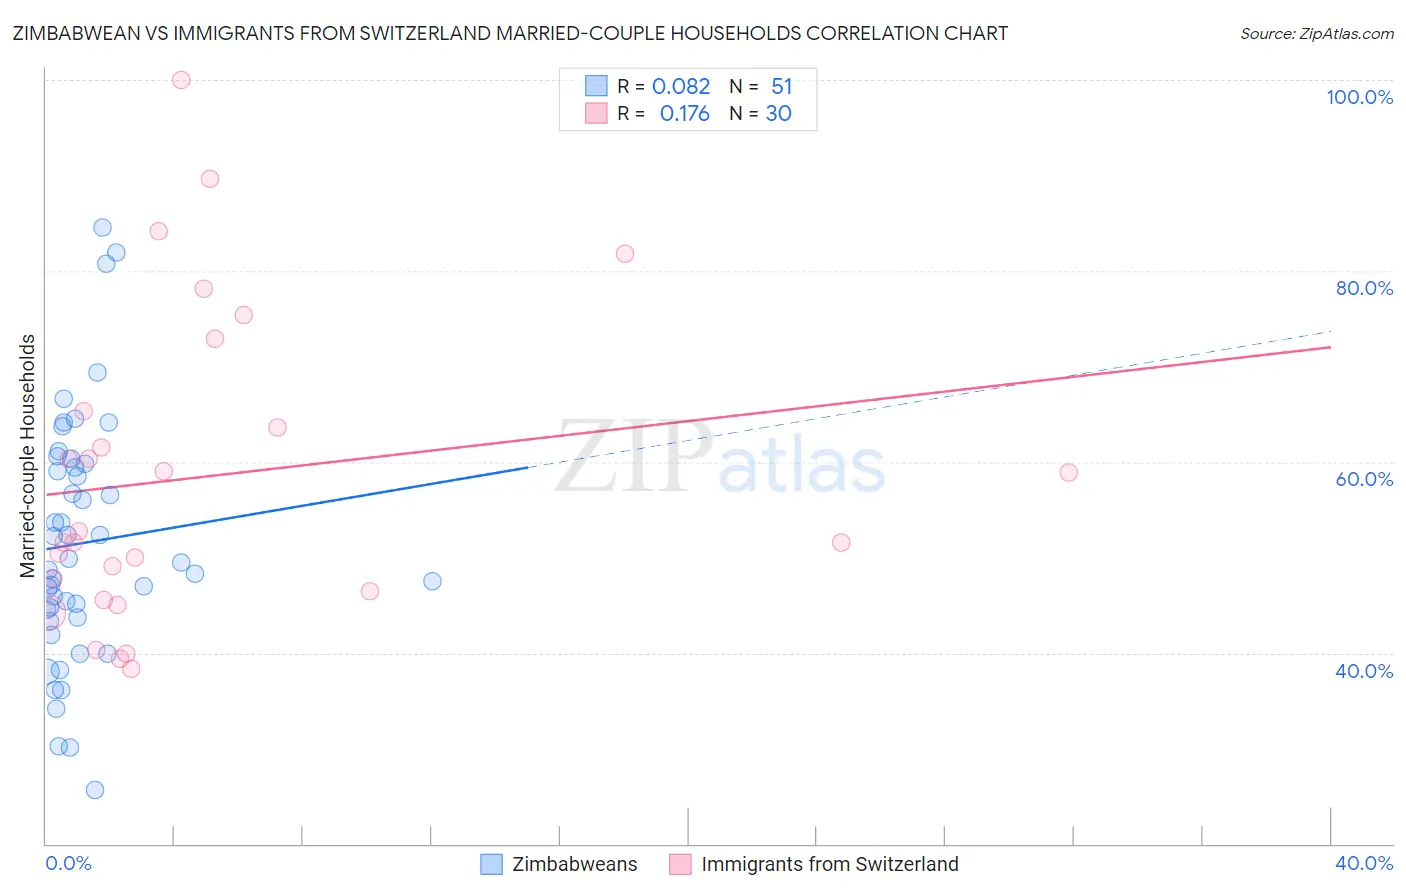
Zimbabwean vs Immigrants from Switzerland Married-couple Households Correlation Chart
The statistical analysis conducted on geographies consisting of 69,192,017 people shows a slight positive correlation between the proportion of Zimbabweans and percentage of married-couple family households in the United States with a correlation coefficient (R) of 0.082 and weighted average of 47.4%. Similarly, the statistical analysis conducted on geographies consisting of 148,072,536 people shows a poor positive correlation between the proportion of Immigrants from Switzerland and percentage of married-couple family households in the United States with a correlation coefficient (R) of 0.176 and weighted average of 46.2%, a difference of 2.5%.
Married-couple Households Correlation Summary
| Measurement | Zimbabwean | Immigrants from Switzerland |
| Minimum | 25.7% | 38.3% |
| Maximum | 84.6% | 100.0% |
| Range | 58.9% | 61.7% |
| Mean | 51.5% | 58.5% |
| Median | 49.5% | 52.2% |
| Interquartile 25% (IQ1) | 43.8% | 46.4% |
| Interquartile 75% (IQ3) | 59.8% | 65.4% |
| Interquartile Range (IQR) | 16.0% | 19.0% |
| Standard Deviation (Sample) | 12.8% | 16.1% |
| Standard Deviation (Population) | 12.6% | 15.8% |
Similar Demographics by Married-couple Households
Demographics Similar to Zimbabweans by Married-couple Households
In terms of married-couple households, the demographic groups most similar to Zimbabweans are Immigrants from Venezuela (47.4%, a difference of 0.010%), Australian (47.4%, a difference of 0.020%), Pakistani (47.3%, a difference of 0.050%), Okinawan (47.4%, a difference of 0.090%), and Celtic (47.3%, a difference of 0.10%).
| Demographics | Rating | Rank | Married-couple Households |
| French Canadians | 92.4 /100 | #117 | Exceptional 47.5% |
| Immigrants | Germany | 92.4 /100 | #118 | Exceptional 47.5% |
| Chileans | 92.2 /100 | #119 | Exceptional 47.5% |
| Puget Sound Salish | 90.5 /100 | #120 | Exceptional 47.4% |
| Immigrants | Eastern Europe | 90.3 /100 | #121 | Exceptional 47.4% |
| Okinawans | 90.1 /100 | #122 | Exceptional 47.4% |
| Immigrants | Venezuela | 89.3 /100 | #123 | Excellent 47.4% |
| Zimbabweans | 89.2 /100 | #124 | Excellent 47.4% |
| Australians | 89.0 /100 | #125 | Excellent 47.4% |
| Pakistanis | 88.6 /100 | #126 | Excellent 47.3% |
| Celtics | 88.1 /100 | #127 | Excellent 47.3% |
| Immigrants | Peru | 87.9 /100 | #128 | Excellent 47.3% |
| Immigrants | Iraq | 87.8 /100 | #129 | Excellent 47.3% |
| Immigrants | Hungary | 87.8 /100 | #130 | Excellent 47.3% |
| Immigrants | Denmark | 87.5 /100 | #131 | Excellent 47.3% |
Demographics Similar to Immigrants from Switzerland by Married-couple Households
In terms of married-couple households, the demographic groups most similar to Immigrants from Switzerland are Brazilian (46.2%, a difference of 0.040%), Immigrants from Brazil (46.2%, a difference of 0.060%), Yugoslavian (46.2%, a difference of 0.080%), Mongolian (46.3%, a difference of 0.20%), and Malaysian (46.3%, a difference of 0.20%).
| Demographics | Rating | Rank | Married-couple Households |
| Immigrants | Immigrants | 43.8 /100 | #177 | Average 46.3% |
| Immigrants | Costa Rica | 43.4 /100 | #178 | Average 46.3% |
| Immigrants | Zimbabwe | 43.0 /100 | #179 | Average 46.3% |
| Mongolians | 42.0 /100 | #180 | Average 46.3% |
| Malaysians | 41.8 /100 | #181 | Average 46.3% |
| Yugoslavians | 38.9 /100 | #182 | Fair 46.2% |
| Immigrants | Brazil | 38.3 /100 | #183 | Fair 46.2% |
| Immigrants | Switzerland | 36.9 /100 | #184 | Fair 46.2% |
| Brazilians | 35.9 /100 | #185 | Fair 46.2% |
| Albanians | 31.1 /100 | #186 | Fair 46.1% |
| Fijians | 29.2 /100 | #187 | Fair 46.1% |
| South American Indians | 28.4 /100 | #188 | Fair 46.0% |
| Immigrants | Latvia | 26.9 /100 | #189 | Fair 46.0% |
| Immigrants | Kuwait | 25.6 /100 | #190 | Fair 46.0% |
| Choctaw | 24.9 /100 | #191 | Fair 46.0% |